
Videos
Laboratory experiments designed to measure LC50 (lethal concentration killing 50%of the test species) values for the effect of certain toxicants on fish are run by two different methods. One method has water continuously flowing through laboratory tanks, and the other method has static water conditions. For purposes of establishing criteria for toxicants, the Environmental Protection Agency (EPA) wants to adjust all results to the flow-through condition. Thus, a model is needed to relate the two types of observations. Observations on toxicants examined under both static and flow-through conditions yielded the data in the accompanying table (measurements in parts per million, ppm). Fit the model Y = β0 + β1x + ε.
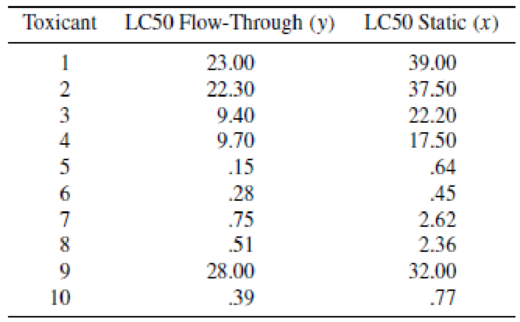
- a What interpretation can you give to the results?
- b Estimate the flow-through value for a toxicant with an LC50 static value of x = 12 ppm.

Trending nowThis is a popular solution!

Chapter 11 Solutions
Mathematical Statistics with Applications


- What does the y -intercept on the graph of a logistic equation correspond to for a population modeled by that equation?arrow_forwardA researcher is investigating the effectiveness of two weight loss treatments. The number of patients attending Treatment A and Treatment B are 30 and 32 respectively. The patients’ weight losses (in Kg) after a two-month treatment period are recorded and shown in Table 1: What type of research design you think this research should be classified? Explain your answer. Based on the research objective of the study, identify the: Independent and dependent variables of this research. Scale of measurement of each of the independent and dependent variables. For EACH of the treatment, determine/construct the following measures and histograms of weight losses using SPSS or any suitable statistical analysis tool: Mean Median Range Histogram d. Based on the histograms of weight losses produced in (c), briefly describe: The shape of distribution of weight losses for EACH treatment. How does the distribution of Treatment A differ from Treatment B e.…arrow_forwardWould someone familiar with SPSS be able to help with sub-question d please?arrow_forward
- A study of breast cancer in postmenopausal women included 500 cases of invasive breast cancer and 500 subjects without breast cancer matched to the cases by age and location of residence. The following data were collected for these subjects about their use of estrogen replacement therapy (ERT). Based on these data, answer the following questions. STATUS CASES CONTROLS Estrogen Replacement Therapy 250 100 No ERT 250 400 2. What is the parameter of interest to be estimated in the study? O Difference in Prevalence O Odds Ratio O Relative Risk O Difference in Incidencearrow_forwardSuppose a researcher wants to see if the proportion of college educated adults is higher in New York compared to Florida. The researcher randomly samples 500 adults in New York and found that 196 had a college education, while a random sample of 600 adults in Florida found that 227 had a college education.At the 0.05 level of significance, does the data provide evidence to suggest the proportion of college educated adults is higher in New York than Florida? Step 1: Define the parameter & setup the testStep 2: State the Level of SignificanceStep 3: Find the value of the Test StatisticsStep 4: Find P-Value OR Find Critical ValueStep 5: State Conclusion and whyarrow_forwardArchaeologists can determine the diets of ancient civilizations by measuring the ratio of carbon-13 to carbon-12 in bones found at burial sites. Large amounts of carbon-13 suggest a diet rich in grasses such as maize, while small amounts suggest a diet based on herbaceous plants. The article "Climate and Diet in Fremont Prehistory: Economic Variability and Abandonment of Maize Agriculture in the Great Salt Lake Basin" (J. Coltrain and S. Leavitt, American Antiquity, 2002:453-485) reports ratios, as a difference from a standard in units of parts per thousand, for bones from individuals in several age groups. The data are presented in the following table. Ratio Age Group (years) 0-11 17.2 18.4 17.9 16.6 19.0 18.3 13.6 13.5 18.5 19.1 19.1 13.4 12-24 14.8 17.6 18.3 17.2 10.0 11.3 10.2 17.0 18.9 19.2 25-45 18.4 13.0 14.8 18.4 12.8 17.6 18.8 179 18.5 17.5 18.3 15.2 10.8 19.8 1 19.2 15.4 13.2 46+ 15.5 18.2 12.7 15.1 18.2 18.0 14.4 10.2 16.7 Construct an ANOVA table. You may give a range for…arrow_forward
- Compare the two separate scatterplots. In particular, how do the associtation compare between women with pets vs. women without pets? Does one group have more variation in systolic blood pressure than the other? If so, for which group? Does systolic blood pressure seem higher for common ages between the two groups? If so, for which group?arrow_forwardPlease answer all parts. And show work. . Needs Complete solution with 100 % accuracy.arrow_forwardThe difference between a regression weight and a beta weight is: A regression weight assumes linearity. A beta weight is for the population while a regression weight is for the sample. A regression weight is less biased. A beta weight is a standardized regression weight.arrow_forward
- Two methods of assembling a television component are under consideration by management. Because of mire expensive machinery requirements, method B will only be adopted if it is significantly shorter than method A by more than a minute. In order to determine which method to adopt a skilled worker becomes proficient in both methods, and is then timed with a stopwatch while assembling the component by both methods. The following data were obtained:arrow_forwardCurrent Attempt in Progress Please use the accompanying Excel data set or accompanying Text file data set when completing the following exercise. An article in Urban Ecosystems, "Urbanization and Warming of Phoenix (Arizona, USA): Impacts, Feedbacks and Mitigation" (2002, Vol. 6, pp. 183-203), mentions that Phoenix is ideal to study the effects of an urban heat island because it has grown from a population of 300,000 to approximately 3 million over the last 50 years and this is a period with a continuous, detailed climate record. The 50-year averages of the mean annual temperatures at eight sites in Phoenix are shown below. Check the assumption of normality in the population with a probability plot. Construct a 99% confidence interval for the standard deviation over the sites of the mean annual temperatures. Site Average Mean Temperature (°C) Sky Harbor Airport 23.3 Phoenix Greenway 21.7 Phoenix Encanto 21.6 21.7 Waddell Litchfield Laveen Maricopa Harlquahala 21.3 i 20.7 20.9 20.1…arrow_forwardA health officer is trying to study the malaria situation of Zambia. From the records of seasonal blood survey (SBS) results he came to understand that the proportion of people having malaria in Zambia was 3.8% in 2015. The size of the sample considered was 15,000. He also realized that during the year that followed (2016), blood samples were taken from 10,000 randomly selected persons. The result of the 2016 seasonal blood survey showed that 200 persons were positive for malaria. Help the Health officer in testing the hypothesis that the malaria situation of 2016 did not show any significant difference from that of 2015 (take the 5% level of significance).arrow_forward
 Linear Algebra: A Modern IntroductionAlgebraISBN:9781285463247Author:David PoolePublisher:Cengage Learning
 Big Ideas Math A Bridge To Success Algebra 1: Stu...AlgebraISBN:9781680331141Author:HOUGHTON MIFFLIN HARCOURTPublisher:Houghton Mifflin Harcourt