
Mathematical Statistics with Applications
7th Edition
ISBN: 9780495110811
Author: Dennis Wackerly, William Mendenhall, Richard L. Scheaffer
Publisher: Cengage Learning
expand_more
expand_more
format_list_bulleted
Concept explainers
Videos
Textbook Question
Chapter 11.12, Problem 74E
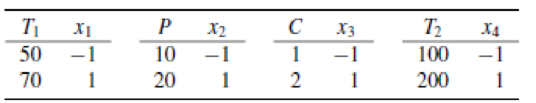
An experiment was conducted to investigate the effect of four factors—temperature T1, pressure P, catalyst C, and temperature T2—on the yield Y of a chemical.
- a The values (or levels) of the four factors used in the experiment are shown in the accompanying table. If each of the four factors is coded to produce the four variables x1, x2, x3, and x4, respectively, give the transformation relating each coded variable to its corresponding original.
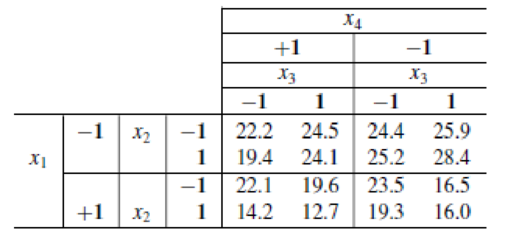
- b Fit the linear model
Y = β0 + β1x1 + β2x2 + β3x3 + β4x4 + ε
to the following table of data.
- c Do the data present sufficient evidence to indicate that T1 contributes information for the estimation of Y? Does P? Does C? Does T2? (Test the hypotheses, respectively, that β1 = 0, β2 = 0, β3 = 0, and β4 = 0.) Give bounds for the p-value associated with each test. What would you conclude if you used α = .01 in each case?
Expert Solution & Answer
Want to see the full answer?
Check out a sample textbook solution
Students have asked these similar questions
Let, X-The level of education and Y-Income
Given data:
X
Y
1
12000
2
14000
3
15000
4
21000
5
23000
6
25080
7
40000
8
50000
Use the information to determine two variables level of education and annual income through visualisation.
. Nutrition The following table gives the calories,fat, and carbohydrates per ounce for three brands ofcereal, as well as the total amount of calories, fat, andcarbohydrates required for a special diet.
To find the number of ounces of each brand thatshould be combined to give the required totals ofcalories, fat, and carbohydrates, let x represent thenumber of ounces of All Bran, y represent thenumber of ounces of Sugar Frosted Flakes, and z represent the number of ounces of Natural Mixed Grain.a. Use the information in the table to write a systemof three equations.b. Solve the system to find the amount of each brandof cereal that will give the necessary nutrition.
d) Suppose you have obtained the following scatter plot when a response variable Y is
regressed on an explanatory variable, X. Based on the plot, what kind of transformation
do you think would appropriate which is related to plot in (b)?
Scatter Plot for Concentration of Solution over Time
1.
8.
ㅇ
Time
Concentration
00
Chapter 11 Solutions
Mathematical Statistics with Applications
Ch. 11.3 - If 0 and 1 are the least-squares estimates for the...Ch. 11.3 - Prob. 2ECh. 11.3 - Fit a straight line to the five data points in the...Ch. 11.3 - Auditors are often required to compare the audited...Ch. 11.3 - Prob. 5ECh. 11.3 - Applet Exercise Refer to Exercises 11.2 and 11.5....Ch. 11.3 - Prob. 7ECh. 11.3 - Laboratory experiments designed to measure LC50...Ch. 11.3 - Prob. 9ECh. 11.3 - Suppose that we have postulated the model...
Ch. 11.3 - Some data obtained by C.E. Marcellari on the...Ch. 11.3 - Processors usually preserve cucumbers by...Ch. 11.3 - J. H. Matis and T. E. Wehrly report the following...Ch. 11.4 - a Derive the following identity:...Ch. 11.4 - An experiment was conducted to observe the effect...Ch. 11.4 - Prob. 17ECh. 11.4 - Prob. 18ECh. 11.4 - A study was conducted to determine the effects of...Ch. 11.4 - Suppose that Y1, Y2,,Yn are independent normal...Ch. 11.4 - Under the assumptions of Exercise 11.20, find...Ch. 11.4 - Prob. 22ECh. 11.5 - Use the properties of the least-squares estimators...Ch. 11.5 - Do the data in Exercise 11.19 present sufficient...Ch. 11.5 - Use the properties of the least-squares estimators...Ch. 11.5 - Let Y1, Y2, . . . , Yn be as given in Exercise...Ch. 11.5 - Prob. 30ECh. 11.5 - Using a chemical procedure called differential...Ch. 11.5 - Prob. 32ECh. 11.5 - Prob. 33ECh. 11.5 - Prob. 34ECh. 11.6 - For the simple linear regression model Y = 0 + 1x...Ch. 11.6 - Prob. 36ECh. 11.6 - Using the model fit to the data of Exercise 11.8,...Ch. 11.6 - Refer to Exercise 11.3. Find a 90% confidence...Ch. 11.6 - Refer to Exercise 11.16. Find a 95% confidence...Ch. 11.6 - Refer to Exercise 11.14. Find a 90% confidence...Ch. 11.6 - Prob. 41ECh. 11.7 - Suppose that the model Y=0+1+ is fit to the n data...Ch. 11.7 - Prob. 43ECh. 11.7 - Prob. 44ECh. 11.7 - Prob. 45ECh. 11.7 - Refer to Exercise 11.16. Find a 95% prediction...Ch. 11.7 - Refer to Exercise 11.14. Find a 95% prediction...Ch. 11.8 - The accompanying table gives the peak power load...Ch. 11.8 - Prob. 49ECh. 11.8 - Prob. 50ECh. 11.8 - Prob. 51ECh. 11.8 - Prob. 52ECh. 11.8 - Prob. 54ECh. 11.8 - Prob. 55ECh. 11.8 - Prob. 57ECh. 11.8 - Prob. 58ECh. 11.8 - Prob. 59ECh. 11.8 - Prob. 60ECh. 11.9 - Refer to Example 11.10. Find a 90% prediction...Ch. 11.9 - Prob. 62ECh. 11.9 - Prob. 63ECh. 11.9 - Prob. 64ECh. 11.9 - Prob. 65ECh. 11.10 - Refer to Exercise 11.3. Fit the model suggested...Ch. 11.10 - Prob. 67ECh. 11.10 - Fit the quadratic model Y=0+1x+2x2+ to the data...Ch. 11.10 - The manufacturer of Lexus automobiles has steadily...Ch. 11.10 - a Calculate SSE and S2 for Exercise 11.4. Use the...Ch. 11.12 - Consider the general linear model...Ch. 11.12 - Prob. 72ECh. 11.12 - Prob. 73ECh. 11.12 - An experiment was conducted to investigate the...Ch. 11.12 - Prob. 75ECh. 11.12 - The results that follow were obtained from an...Ch. 11.13 - Prob. 77ECh. 11.13 - Prob. 78ECh. 11.13 - Prob. 79ECh. 11.14 - Prob. 80ECh. 11.14 - Prob. 81ECh. 11.14 - Prob. 82ECh. 11.14 - Prob. 83ECh. 11.14 - Prob. 84ECh. 11.14 - Prob. 85ECh. 11.14 - Prob. 86ECh. 11.14 - Prob. 87ECh. 11.14 - Prob. 88ECh. 11.14 - Refer to the three models given in Exercise 11.88....Ch. 11.14 - Prob. 90ECh. 11.14 - Prob. 91ECh. 11.14 - Prob. 92ECh. 11.14 - Prob. 93ECh. 11.14 - Prob. 94ECh. 11 - At temperatures approaching absolute zero (273C),...Ch. 11 - A study was conducted to determine whether a...Ch. 11 - Prob. 97SECh. 11 - Prob. 98SECh. 11 - Prob. 99SECh. 11 - Prob. 100SECh. 11 - Prob. 102SECh. 11 - Prob. 103SECh. 11 - An experiment was conducted to determine the...Ch. 11 - Prob. 105SECh. 11 - Prob. 106SECh. 11 - Prob. 107SE
Knowledge Booster


Learn more about
Need a deep-dive on the concept behind this application? Look no further. Learn more about this topic, statistics and related others by exploring similar questions and additional content below.Similar questions
- The actual color a viewer sees on a screen is influenced by the specific type and amount of phosphors on the screen. So each computer screen manufacturer must convert between the (R, G, B) data and an international CIE standard for color, which uses three primary colors, called X, Y, and Z. A typical conversion for short-persistence phosphors is shown to the right. A computer program will send a stream of color information to the screen, using standard CIE data (X, Y, Z). Find the equation that converts these data to the (R, G, B) data needed for the screen's electron gun. G 121 1²2 cal forach mement Round to four decimal place) (Type an or as Y C 0.45 0.26 0.158 0.34 0.65 0.063 0.02 0.16 0.841 R B X Y Zarrow_forwardThe head of the production department of FPDJ Electronic Company wants to determine the relationship between the number of workers who assemble a particular electronic gadget and the number of units of that product assembled per day. Totals: No. of Workers No. of Units Produced Y 120 180 220 224 176 320 270 275 1785 X 10 12 14 16 13 20 18 17 120 XY 1200 2160 3080 3584 2288 6400 4860 4675 28247 y² 100 14400 144 32400 196 48400 256 50176 169 30976 400 102400 324 72900 289 75625 1878 427277 X² Using the best-fit line (regression line), estimate the number of units that will be produced if there will be 19 workers.arrow_forwardIn the production process of a company, 4 units of a certain input are used daily. It happens that the different formulations of this input can affect the yield of the process as well as the level of environmental pollution. On a given day the company has 40 units of this input in stock and they can be classified according to the table below:arrow_forward
- The r code for side by side boxplot of vitamind v newage and vitamin d v country. Scatterplot code for relationship between vitamin d level and age.arrow_forwardOnly b.ii, iii and iv please. The output of a solar panel (photovoltaic) system depends on its size. A manufacturer states that the average daily production of its 1.5 kW system is 6.6 kilowatt hours (kWh) for Perth conditions. A consumer group monitored this 1.5 kW system in 20 different Perth homes and measured the average daily production by the systems in these homes over a one month period during October. The data is provided here. (a) Analyse the consumer group’s data to test if the manufacturer’s claim of an average of 6.6 kWh per day is reasonable. State appropriate hypotheses, assumptions and decision rule at α = 0.10. What conclusions would you report to the consumer group? Hint: You will need to find Descriptive Statistics first.) (b) If 48 homes in the central Australian city of Alice Springs had this system installed and similar data wascollected, in order to assess whether average daily production in Alice Springs exceeded 6.6 kWh, (i) what would the alternate hypothesis…arrow_forwardA quality control engineer studied the relationship between years of experience as a system control engineer and the capacity of the engineer to complete within a given time a complex control design including the debugging of all computer programs and control devices. A group of 25 engineers having widely differing amounts of experience (measured in months of experience) was given the same control design project. The results of the study are given in the following table with y 5 1 if the project was successfully completed in the allocated time and y 5 0 if the project was not successfully completed. a. Determine whether experience is associated with the probability of completing the task. b. Compute the probability of successfully completing the task for an engineer havingarrow_forward
- A researcher assessed the effects of a new drug on migraine headaches. One sample of migraine sufferers received a placebo pill (0 milligrams of the drug) every day for a month. A second sample received a 10-mg dose of the drug daily for a month, and a third sample received daily doses of 20-mg. The number of headaches each person had during the month was recorded. The results are summarized in the following table: What is the independent variable (IV)? How many levels do we have for the IV? What is the level of measurement for the IV? What is the DV (remember, the DV is the data)? What is the level of measurement of the DV? What is the best graph to display this data? Explain. Construct a graph (by hand) that incorporates all the information in this table. Looking at your graph, do you think that the new drug treatment really worked. Explain your answer.arrow_forwardIncluding an interaction term between two independent variables, X1 and X2, allows for the following: a. the interaction term lets the effect on Y of a change in X1 depend on the value of X2. b. the effect of a unit increase in X1, keeping X2 constant, is transmitted through the coefficient on X1 and the interaction term coefficient. c. the interaction term lets the effect on Y of a change in X2 depend on the value of X1. d. the effect of a unit increase in X2, keeping X1 constant, is transmitted through the coefficient on X2 and the interaction term coefficient. e. All of the above. f. None of the above.arrow_forwardA sensory Psychologist wants to test if age affects a person's ability to detect changes in color presented on a computer screen. She recruits 3 different age groups (young, mid aged, elderly) to test. She also wants to know if bilingual people are different in their ability to detect color changes relative to non bilingual people, so half of the 60 participants are bilingual, the other not bilingual. Complete the source table below for her results. Complete the source table below and answer the question that follows the table also Source SS df MS Fcalculated Fcritical p __ .05 Between 360 5 FactorAge FactorBilingual 220 Interaction 95 Within 1825 54 Total Was there a significant effect of age? ______arrow_forward
- When we assess X1 as a predictor of Y, there are several ways in which we can add a third variable (X2) and several “stories” that may describe the relations among variables. Assess how X1, Y relation separately for each group on the X2 variable.arrow_forwardThe electric power consumed each month by a chemical plant is thought to be related to the average ambient temperature x1, the number of days in the month x2, the average product purity x3, and the tons of product produced x4. The past year's historical data are available and are presented in the following table. 240 25 24 91 100 236 31 21 90 95 290 45 24 88 110 274 60 25 87 88 25 26 25 301 65 91 94 316 72 94 99 300 80 87 97 84 75 296 25 86 96 267 24 88 110 276 60 25 91 105 288 50 38 25 23 90 100 261 89 98 If y= ao+a1X1 +a2x2+Q3X3+Q4X4 represents the regression model. What is the value of a2? Use 2 decimal places.arrow_forwardWhich of the following is (are) TRUE in presenting results of analysis using transformation? The means may be presented in the original scale. The back-transformed means may be presented. A. I only B. II only C. Both I and II D. Neither I nor IIarrow_forward
arrow_back_ios
SEE MORE QUESTIONS
arrow_forward_ios
Recommended textbooks for you
 MATLAB: An Introduction with ApplicationsStatisticsISBN:9781119256830Author:Amos GilatPublisher:John Wiley & Sons Inc
 Probability and Statistics for Engineering and th...StatisticsISBN:9781305251809Author:Jay L. DevorePublisher:Cengage Learning
 Statistics for The Behavioral Sciences (MindTap C...StatisticsISBN:9781305504912Author:Frederick J Gravetter, Larry B. WallnauPublisher:Cengage Learning
 Elementary Statistics: Picturing the World (7th E...StatisticsISBN:9780134683416Author:Ron Larson, Betsy FarberPublisher:PEARSON
 The Basic Practice of StatisticsStatisticsISBN:9781319042578Author:David S. Moore, William I. Notz, Michael A. FlignerPublisher:W. H. Freeman
 Introduction to the Practice of StatisticsStatisticsISBN:9781319013387Author:David S. Moore, George P. McCabe, Bruce A. CraigPublisher:W. H. Freeman
MATLAB: An Introduction with Applications
Statistics
ISBN:9781119256830
Author:Amos Gilat
Publisher:John Wiley & Sons Inc
Probability and Statistics for Engineering and th...
Statistics
ISBN:9781305251809
Author:Jay L. Devore
Publisher:Cengage Learning
Statistics for The Behavioral Sciences (MindTap C...
Statistics
ISBN:9781305504912
Author:Frederick J Gravetter, Larry B. Wallnau
Publisher:Cengage Learning
Elementary Statistics: Picturing the World (7th E...
Statistics
ISBN:9780134683416
Author:Ron Larson, Betsy Farber
Publisher:PEARSON
The Basic Practice of Statistics
Statistics
ISBN:9781319042578
Author:David S. Moore, William I. Notz, Michael A. Fligner
Publisher:W. H. Freeman
Introduction to the Practice of Statistics
Statistics
ISBN:9781319013387
Author:David S. Moore, George P. McCabe, Bruce A. Craig
Publisher:W. H. Freeman
Which is the best chart: Selecting among 14 types of charts Part II; Author: 365 Data Science;https://www.youtube.com/watch?v=qGaIB-bRn-A;License: Standard YouTube License, CC-BY