
Mathematical Statistics with Applications
7th Edition
ISBN: 9780495110811
Author: Dennis Wackerly, William Mendenhall, Richard L. Scheaffer
Publisher: Cengage Learning
expand_more
expand_more
format_list_bulleted
Concept explainers
Videos
Textbook Question
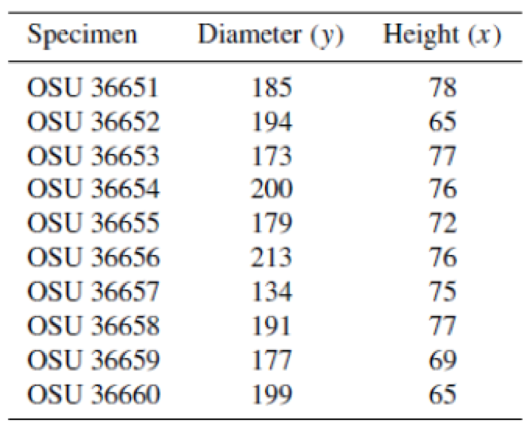
Chapter 11.3, Problem 11E
Some data obtained by C.E. Marcellari on the height x and diameter y of shells appear in the following table. If we consider the model
then the slope β1 is the ratio of the
Expert Solution & Answer

Trending nowThis is a popular solution!

Students have asked these similar questions
Solids (grams) obtained from a material as y, with respect to drying time (Hours) as x. Ten experiments were carried out to obtain the following observations:
Table on the picture
(a) Create a scatter diagram for the data.
(b) Estimated regression model according to the data conditions.
(c) Calculate Model Accuracy (R²) and Relationship Between Variables (r²)
Fit a straight line to the data and determine the slope, m, and intercept, c,
assuming an unweighted least-squares fit is appropriate. Give m and c to
three significant figures.
Table 6.13 Variation of intensity of light
reflected from a lithium fluoride crystal as a
function of the angular position of a polariser
0 (degrees)
Intensity (arbitrary units)
1.86
20
1.63
40
1.13
60
0.52
80
0.16
100
0.00
120
0.57
140
1.11
160
1.56
180
1.71
Consider the bivariate dataset for variable X and variable Y given by the table.
Group
Y
A
9
8
B
4
D
8
6
Solve the following questions.
a. Find the sum of X^2:
b. Find the Correlation coefficient:
c Estimate the slope of the regression line:
4.
3.
Chapter 11 Solutions
Mathematical Statistics with Applications
Ch. 11.3 - If 0 and 1 are the least-squares estimates for the...Ch. 11.3 - Prob. 2ECh. 11.3 - Fit a straight line to the five data points in the...Ch. 11.3 - Auditors are often required to compare the audited...Ch. 11.3 - Prob. 5ECh. 11.3 - Applet Exercise Refer to Exercises 11.2 and 11.5....Ch. 11.3 - Prob. 7ECh. 11.3 - Laboratory experiments designed to measure LC50...Ch. 11.3 - Prob. 9ECh. 11.3 - Suppose that we have postulated the model...
Ch. 11.3 - Some data obtained by C.E. Marcellari on the...Ch. 11.3 - Processors usually preserve cucumbers by...Ch. 11.3 - J. H. Matis and T. E. Wehrly report the following...Ch. 11.4 - a Derive the following identity:...Ch. 11.4 - An experiment was conducted to observe the effect...Ch. 11.4 - Prob. 17ECh. 11.4 - Prob. 18ECh. 11.4 - A study was conducted to determine the effects of...Ch. 11.4 - Suppose that Y1, Y2,,Yn are independent normal...Ch. 11.4 - Under the assumptions of Exercise 11.20, find...Ch. 11.4 - Prob. 22ECh. 11.5 - Use the properties of the least-squares estimators...Ch. 11.5 - Do the data in Exercise 11.19 present sufficient...Ch. 11.5 - Use the properties of the least-squares estimators...Ch. 11.5 - Let Y1, Y2, . . . , Yn be as given in Exercise...Ch. 11.5 - Prob. 30ECh. 11.5 - Using a chemical procedure called differential...Ch. 11.5 - Prob. 32ECh. 11.5 - Prob. 33ECh. 11.5 - Prob. 34ECh. 11.6 - For the simple linear regression model Y = 0 + 1x...Ch. 11.6 - Prob. 36ECh. 11.6 - Using the model fit to the data of Exercise 11.8,...Ch. 11.6 - Refer to Exercise 11.3. Find a 90% confidence...Ch. 11.6 - Refer to Exercise 11.16. Find a 95% confidence...Ch. 11.6 - Refer to Exercise 11.14. Find a 90% confidence...Ch. 11.6 - Prob. 41ECh. 11.7 - Suppose that the model Y=0+1+ is fit to the n data...Ch. 11.7 - Prob. 43ECh. 11.7 - Prob. 44ECh. 11.7 - Prob. 45ECh. 11.7 - Refer to Exercise 11.16. Find a 95% prediction...Ch. 11.7 - Refer to Exercise 11.14. Find a 95% prediction...Ch. 11.8 - The accompanying table gives the peak power load...Ch. 11.8 - Prob. 49ECh. 11.8 - Prob. 50ECh. 11.8 - Prob. 51ECh. 11.8 - Prob. 52ECh. 11.8 - Prob. 54ECh. 11.8 - Prob. 55ECh. 11.8 - Prob. 57ECh. 11.8 - Prob. 58ECh. 11.8 - Prob. 59ECh. 11.8 - Prob. 60ECh. 11.9 - Refer to Example 11.10. Find a 90% prediction...Ch. 11.9 - Prob. 62ECh. 11.9 - Prob. 63ECh. 11.9 - Prob. 64ECh. 11.9 - Prob. 65ECh. 11.10 - Refer to Exercise 11.3. Fit the model suggested...Ch. 11.10 - Prob. 67ECh. 11.10 - Fit the quadratic model Y=0+1x+2x2+ to the data...Ch. 11.10 - The manufacturer of Lexus automobiles has steadily...Ch. 11.10 - a Calculate SSE and S2 for Exercise 11.4. Use the...Ch. 11.12 - Consider the general linear model...Ch. 11.12 - Prob. 72ECh. 11.12 - Prob. 73ECh. 11.12 - An experiment was conducted to investigate the...Ch. 11.12 - Prob. 75ECh. 11.12 - The results that follow were obtained from an...Ch. 11.13 - Prob. 77ECh. 11.13 - Prob. 78ECh. 11.13 - Prob. 79ECh. 11.14 - Prob. 80ECh. 11.14 - Prob. 81ECh. 11.14 - Prob. 82ECh. 11.14 - Prob. 83ECh. 11.14 - Prob. 84ECh. 11.14 - Prob. 85ECh. 11.14 - Prob. 86ECh. 11.14 - Prob. 87ECh. 11.14 - Prob. 88ECh. 11.14 - Refer to the three models given in Exercise 11.88....Ch. 11.14 - Prob. 90ECh. 11.14 - Prob. 91ECh. 11.14 - Prob. 92ECh. 11.14 - Prob. 93ECh. 11.14 - Prob. 94ECh. 11 - At temperatures approaching absolute zero (273C),...Ch. 11 - A study was conducted to determine whether a...Ch. 11 - Prob. 97SECh. 11 - Prob. 98SECh. 11 - Prob. 99SECh. 11 - Prob. 100SECh. 11 - Prob. 102SECh. 11 - Prob. 103SECh. 11 - An experiment was conducted to determine the...Ch. 11 - Prob. 105SECh. 11 - Prob. 106SECh. 11 - Prob. 107SE
Knowledge Booster


Learn more about
Need a deep-dive on the concept behind this application? Look no further. Learn more about this topic, statistics and related others by exploring similar questions and additional content below.Similar questions
- The following table provides values of the function f(x,y). However, because of potential; errors in measurement, the functional values may be slightly inaccurately. Using the statistical package included with a graphical calculator or spreadsheet and critical thinking skills, find the function f(x,y)=a+bx+cy that best estimate the table where a, b and c are integers. Hint: Do a linear regression on each column with the value of y fixed and then use these four regression equations to determine the coefficient c. x y 0 1 2 3 0 4.02 7.04 9.98 13.00 1 6.01 9.06 11.98 14.96 2 7.99 10.95 14.02 17.09 3 9.99 13.01 16.01 19.02arrow_forwardRespiratory Rate Researchers have found that the 95 th percentile the value at which 95% of the data are at or below for respiratory rates in breath per minute during the first 3 years of infancy are given by y=101.82411-0.0125995x+0.00013401x2 for awake infants and y=101.72858-0.0139928x+0.00017646x2 for sleeping infants, where x is the age in months. Source: Pediatrics. a. What is the domain for each function? b. For each respiratory rate, is the rate decreasing or increasing over the first 3 years of life? Hint: Is the graph of the quadratic in the exponent opening upward or downward? Where is the vertex? c. Verify your answer to part b using a graphing calculator. d. For a 1- year-old infant in the 95 th percentile, how much higher is the walking respiratory rate then the sleeping respiratory rate? e. f.arrow_forwardFind the equation of the regression line for the following data set. x 1 2 3 y 0 3 4arrow_forward
- bThe average rate of change of the linear function f(x)=3x+5 between any two points is ________.arrow_forwardIs there a relation between the age difference between husband/wives and the percent of a country that is literate? Researchers found the least-squares regression between age difference (husband age minus wife age), y, and literacy rate (percent of the population that is literate), x, is ŷ= -0.0569x + 8.5. The model applied for 23 ≤ x ≤ 100. Complete parts (a) through (e) below. (a) Interpret the slope. Select the correct choice below and fill in the answer box to complete your choice. For every unit increase in falls by units, on average. (Type an integer or decimal. Do not round.) (b) Does it make sense to interpret the y-intercept? Explain. Choose the correct answer below. ▼ the O A. Yes-it makes sense to interpret the y-intercept because an x-value of 0 is within the realm of possibilities. OB. No-it does not make sense to interpret the y-intercept because a y-value of 0 is impossible. OC. No-it does not make sense to interpret the y-intercept because an x-value of 0 is outside the…arrow_forwardThe following data shows the atmospheric pollutants yi(relative to an EPA standard) at half hour interval xi. Find the equation y=a+bx of the least square line that best fits the data points given by 2,1, 5,2, 7,3, 8,3. Hence predict the atmospheric pollutant at x=6 half hour.arrow_forward
- Q1: The data points below are related to a chemi-thermo-mechanical pulp from mixed density hardwoods. They relate Y (specific surface area of the fibres in cm/g) to the % NaOH (sodium hydroxide) used as a pretreatment chemical and the treatment time (min) for different batches of pulp. The variables are present at three different levels. In this case, it is preferred (for reasons that we will discuss later in the course) to code the levels as shown in the last two columns of the table below, designated by Xı and X2. Y SODIUM ΤΙME Xi X2 HYDROXIDE 5.95 3 30 -1 5.60 3 60 -1 5.44 3 90 -1 1 6.22 9. 30 -1 5.85 9 60 5.61 9. 90 1 8.36 15 30 1 -1 7.30 15 60 1 6.43 15 90 1 1 a. Using the variables Y, X1 and X2 (not actual time and sodium hydroxide! You will see why later!), fit the following multiple linear regression model to the data: (Model A) Y = (b0) + (b1) X1 + (b2) X2; subsequently, estimate the parameters and examine the residual plot (residuals vs Y hat). What does this residual plot…arrow_forwardThe scatter plot below shows the average cost of a designer jacket in a sample of years between 2000 and 2015. The least squares regression line modeling this data is given by yˆ=−4815+3.765x. A scatterplot has a horizontal axis labeled Year from 2005 to 2015 in increments of 5 and a vertical axis labeled Price ($) from 2660 to 2780 in increments of 20. The following points are plotted: (2003, 2736); (2004, 2715); (2007, 2675); (2009, 2719); (2013, 270). All coordinates are approximate. Interpret the slope of the least squares regression line. Select the correct answer below: 1.The average cost of a designer jacket decreased by $3.765 each year between 2000 and 2015. 2.The average cost of a designer jacket increased by $3.765 each year between 2000 and 2015. 3.The average cost of a designer jacket decreased by $4815 each year between 2000 and 2015. 4. The average cost of a designer jacket increased by $4815 each year between 2000 and…arrow_forward) A real estate magazine reported the results of a regression analysis designed to predict theprice (y), measured in dollars, of residential properties recently sold in a northern Virginiasubdivision. One independent variable used to predict sale price is GLA, gross living area(x), measured in square feet. Data for 157 properties were used to fit the model,? = β0 + β1x.The results of the simple linear regression are provided below.y = 96,600 +22.5x s = 6500 r2 = -0.77 t = 6.1 (for testing β1)Interpret the estimate of β0 the y-intercept of the line.a. About 95% of the observed sale prices fall within $96,600 of the least squares line.b. There is no practical interpretation, since a gross living area of 0 is a nonsensicalvalue.c. All residential properties in Virginia will sell for at least $96,600.d. For every 1-sq ft. increase in GLA, we expect a property's sale price to increase$96,600.arrow_forward
arrow_back_ios
arrow_forward_ios
Recommended textbooks for you
 Calculus For The Life SciencesCalculusISBN:9780321964038Author:GREENWELL, Raymond N., RITCHEY, Nathan P., Lial, Margaret L.Publisher:Pearson Addison Wesley,
 Algebra & Trigonometry with Analytic GeometryAlgebraISBN:9781133382119Author:SwokowskiPublisher:Cengage
 Functions and Change: A Modeling Approach to Coll...AlgebraISBN:9781337111348Author:Bruce Crauder, Benny Evans, Alan NoellPublisher:Cengage Learning
 Algebra and Trigonometry (MindTap Course List)AlgebraISBN:9781305071742Author:James Stewart, Lothar Redlin, Saleem WatsonPublisher:Cengage Learning
Calculus For The Life Sciences
Calculus
ISBN:9780321964038
Author:GREENWELL, Raymond N., RITCHEY, Nathan P., Lial, Margaret L.
Publisher:Pearson Addison Wesley,
Algebra & Trigonometry with Analytic Geometry
Algebra
ISBN:9781133382119
Author:Swokowski
Publisher:Cengage
Functions and Change: A Modeling Approach to Coll...
Algebra
ISBN:9781337111348
Author:Bruce Crauder, Benny Evans, Alan Noell
Publisher:Cengage Learning
Algebra and Trigonometry (MindTap Course List)
Algebra
ISBN:9781305071742
Author:James Stewart, Lothar Redlin, Saleem Watson
Publisher:Cengage Learning
Correlation Vs Regression: Difference Between them with definition & Comparison Chart; Author: Key Differences;https://www.youtube.com/watch?v=Ou2QGSJVd0U;License: Standard YouTube License, CC-BY
Correlation and Regression: Concepts with Illustrative examples; Author: LEARN & APPLY : Lean and Six Sigma;https://www.youtube.com/watch?v=xTpHD5WLuoA;License: Standard YouTube License, CC-BY