
Videos
Internal Business Process Performance Measures
Tombro Industries is in the process of automating one of its plants and developing a flexible manufacturing system. The company is finding it necessary to mate many changes in operating procedures. Progress has been slow, particularly in trying to develop new performance measures for the factory.
In an effort to evaluate performance and determine where improvements can be made, management has gathered the following data relating to activities over the last four months: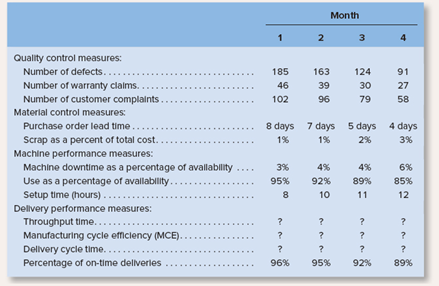
The president has read in industry journals that throughput time: MCE and delivery cycle time are important measures of performance, but no one is sure how they are computed. You have been asked to assist the company, and you have gathered the following data relating to these measures: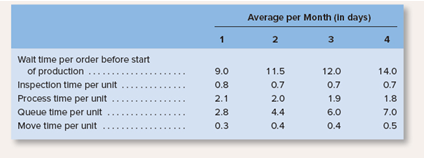
Required:
1. For each month compute the following performance measures:
a. Throughput time.
b. MCE.
c. Delivery cycle time.
2. Using the performance measures given in the main body of the problem and the performance measures computed in (1) above, do the following:
a. Identify areas where the company seems to be improving.
b. Identify areas where the company seems to be deteriorating.
3. Refer to the inspection time, process time, and so forth, given for month 4.
a. Assume that in month 5 the inspection time, process time, and so forth, are the same as for month 4. except that the company is able to completely eliminate the queue time during production using Lean Production. Compute the new throughput time and MCE.
b. Assume that in month 6 the inspection time, process time, and so forth, are the same as in month 4, except that the company is able to eliminate both the queue time during production and the inspection time using Lean Production. Compute the new throughput time and MCE.
1)
Delivery Cycle, Throughput Time, Manufacturing Cycle Efficiency:
The time taken from the start of the sale process, i.e. the receipt of a confirmed sales order, to the completion of the transfer of goods or services, i.e. dispatch of goods is known as the Delivery Cycle.
It consists of throughput time, Value added time and non-value added time.
To depict delivery cycle in the formula form, the following formula maybe used:
Delivery Cycle = Value added Elements of Throughput Time + Non Value Added Elements of Throughput Time.
Manufacturing Cycle Efficiency is an internal business performance parameter with respect to manufacturing processes and industries. It measures the total time taken by value added activities in relation to the throughput time.
- Throughput Time
- Delivery Cycle
- Manufacturing Cycle Efficiency
Answer to Problem 19P
Solution:
| Average Time per month (in days) | ||||
| Particulars | 1 | 2 | 3 | 4 |
| Throughput Time | 7.30 | 8.10 | 8.80 | 9.60 |
| Delivery Cycle | 16.30 | 19.60 | 20.80 | 23.60 |
| Manufacturing Cycle Efficiency | 0.29 | 0.25 | 0.22 | 0.19 |
Explanation of Solution
- Throughput time comprises of two main categories of elements i.e. Value added and Non Value added elements.
- Value added elements refer to the time taken for those activities that add quality and value to the overall production process concerning manufacture of goods. Example − Process Time.
- Process time is the time spent on actually producing the product. It refers to the time taken to convert the goods from raw materials to interim or final finished products
- Non Value added elements refer to the time taken for those activities that do not add quality and value to the overall production process concerning manufacture of goods and that need to be eliminated to the greatest extent possible. Example - Inspection Time, Move Time and Queue time
- Inspection time is the amount of time spent assuring that the product is defect free to the best possible extent
- Move time is the time required to transfer raw materials or interim or final finished products from one location to another, such as factory to job workers’ location.
- Queue time is the amount of time that is spent waiting for the actually production activities to commence since other products are being produced or worked upon.
- Given:
| Average Time per month (in days) | ||||
| Particulars | 1.0 | 2.0 | 3.0 | 4.0 |
| Move time per unit | 0.3 | 0.4 | 0.4 | 0.5 |
| Process Time per unit | 2.1 | 2.0 | 1.9 | 1.8 |
| Wait time per order | 9.0 | 11.5 | 12.0 | 14.0 |
| Queue Time per unit | 4.3 | 5.0 | 5.8 | 6.7 |
| Inspection Time per unit | 0.6 | 0.7 | 0.7 | 0.6 |
- Formulas Used:
- Total Throughput Time = Time Taken by value added activities + Time Taken by Non value added activities (Except Wait Time)
- Delivery Cycle = Non Value Added activities + Total Throughput Time
- Manufacturing cycle efficiency = Time Taken by value added activities / Total Throughput Time.
- Time Taken by value added activities = Time taken for Process Time
- Time Taken by Non value added activities = Time taken for Move Time + Queue Time + Inspection Time
- Calculations:
| Average Time per month (in days) | ||||
| Particulars | 1.0 | 2.0 | 3.0 | 4.0 |
| Move time per unit | 0.3 | 0.4 | 0.4 | 0.5 |
| Queue Time per unit | 4.3 | 5.0 | 5.8 | 6.7 |
| Inspection Time per unit | 0.6 | 0.7 | 0.7 | 0.6 |
| Total Time For Non Value Added Activities (A) | 5.2 | 6.1 | 6.9 | 7.8 |
| Process Time per unit | 2.1 | 2.0 | 1.9 | 1.8 |
| Total Time For Non Value Added Activities (B) | 2.1 | 2.0 | 1.9 | 1.8 |
| Throughput Time (A+B) [C] | 7.3 | 8.1 | 8.8 | 9.6 |
| Wait time per order [D] | 9.0 | 11.5 | 12.0 | 14.0 |
| Delivery Cycle (C+D) | 16.3 | 19.6 | 20.8 | 23.6 |
| Manufacturing Cycle Efficiency | Time Taken by value added activities / Total Throughput Time. | |||
| Manufacturing Cycle Efficiency | 0.29 | 0.25 | 0.22 | 0.19 |
Hence the throughput time, delivery cycle, and manufacturing cycle efficiency has been calculated for each months.
2)
Evaluation of Manufacturing Cycle efficiency and its’ components
The time taken from the start of the sale process, i.e. the receipt of a confirmed sales order, to the completion of the transfer of goods or services, i.e. dispatch of goods is known as the Delivery Cycle.
It consists of throughput time, Value added time and non-value added time.
To depict delivery cycle in the formula form, the following formula maybe used:
Delivery Cycle = Value added Elements of Throughput Time + Non Value Added Elements of Throughput Time.
Manufacturing Cycle Efficiency is an internal business performance parameter with respect to manufacturing processes and industries. It measures the total time taken by value added activities in relation to the throughput time.
Hence evaluation has to be done of the following parameters:
- Throughput time
- Delivery Cycle Time
- Manufacturing Cycle Efficiency
- Areas where company’s performance is improving.
- Areas where company’s performance is deteriorating.
Answer to Problem 19P
Solution:
- Areas where company’s performance is improving are None
- Areas where company’s performance is deteriorating are throughput time and delivery cycle time and manufacturing cycle efficiency.
Explanation of Solution
- Throughput time comprises of two main categories of elements i.e. Value added and Non Value added elements.
- Value added elements refer to the time taken for those activities that add quality and value to the overall production process concerning manufacture of goods. Example − Process Time.
- Non Value added elements refer to the time taken for those activities that do not add quality and value to the overall production process concerning manufacture of goods and that need to be eliminated to the greatest extent possible. Example - Inspection Time, Move Time and Queue time
- Following are the Throughput time for four months:
| Average Time per month (in days) | ||||
| Particulars | 1 | 2 | 3 | 4 |
| Throughput Time | 7.30 | 8.10 | 8.80 | 9.60 |
- Since the total throughput time is increasing, it can be said the company’s performance is deteriorating.
- The time taken from the start of the sale process, i.e. the receipt of a confirmed sales order, to the completion of the transfer of goods or services, i.e. dispatch of goods is known as the Delivery Cycle.
- Following are the Delivery cycle times for four months:
| Average Time per month (in days) | ||||
| Particulars | 1 | 2 | 3 | 4 |
| Delivery Cycle | 16.30 | 19.60 | 20.80 | 23.60 |
- Since the total delivery cycle time is increasing, it can be said the company’s performance is deteriorating.
- Manufacturing cycle efficiency helps keep track of where time and cost is incurred in non-value added activities and performance efficiency measurement.
- Manufacturing cycle efficiency is denoted by the following formula:
Manufacturing cycle efficiency = Time Taken by value added activities / Total Throughput Time.
Total Throughput Time = Time Taken by value added activities + Time Taken by Non value added activities
- For example if the time Taken by value added activities is 25 minutes per unit and the Time Taken by non-value added activities is 35 minutes then manufacturing cycle efficiency would be 0.42.
- Thus it can be interpreted as, the value added activities take up only 42 % of the total time taken to complete the manufacturing process and the rest is attributable to non-value added activities.
| Average Time per month (in days) | ||||
| Particulars | 1 | 2 | 3 | 4 |
| Manufacturing Cycle Efficiency | 0.29 | 0.25 | 0.22 | 0.19 |
- Since the Manufacturing Cycle Efficiency is decreasing, the company’s performance is deteriorating.
Hence the performance measures where the company’s performance is increasing and decreasing are enumerated.
3)
a)
Throughput Time, Manufacturing Cycle Efficiency
The time taken from the start of the sale process, i.e. the receipt of a confirmed sales order, to the completion of the transfer of goods or services, i.e. dispatch of goods is known as the Delivery Cycle.
It consists of throughput time, Value added time and non-value added time.
To depict delivery cycle in the formula form, the following formula maybe used:
Delivery Cycle = Value added Elements of Throughput Time + Non Value Added Elements of Throughput Time.
Manufacturing Cycle Efficiency is an internal business performance parameter with respect to manufacturing processes and industries. It measures the total time taken by value added activities in relation to the throughput time.
- Throughput Time for Month 5
- Manufacturing Cycle Efficiency for Month 5
Answer to Problem 19P
Solution:
| Average Time per month (in days) | ||
| Particulars | 4 | 5 |
| Throughput Time | 9.60 | 2.90 |
| Manufacturing Cycle Efficiency for month 5 | 0.19 | 0.62 |
Explanation of Solution
- Throughput time comprises of two main categories of elements i.e. Value added and Non Value added elements.
- Value added elements refer to the time taken for those activities that add quality and value to the overall production process concerning manufacture of goods. Example − Process Time.
- Process time is the time spent on actually producing the product. It refers to the time taken to convert the goods from raw materials to interim or final finished products
- Non Value added elements refer to the time taken for those activities that do not add quality and value to the overall production process concerning manufacture of goods and that need to be eliminated to the greatest extent possible. Example - Inspection Time, Move Time and Queue time
- Inspection time is the amount of time spent assuring that the product is defect free to the best possible extent
- Move time is the time required to transfer raw materials or interim or final finished products from one location to another, such as factory to job workers’ location.
- Queue time is the amount of time that is spent waiting for the actually production activities to commence since other products are being produced or worked upon.
- Given:
| Particulars | 4 | 5 |
| Move time per unit | 0.5 | 0.5 |
| Queue Time per unit | 6.7 | 0.0 |
| Inspection Time per unit | 0.6 | 0.6 |
| Process Time per unit | 1.8 | 1.8 |
- Total Throughput Time = Time Taken by value added activities + Time Taken by Non value added activities (Except Wait Time)
- Manufacturing cycle efficiency = Time Taken by value added activities / Total Throughput Time.
- Time Taken by value added activities = Time taken for Process Time
- Time Taken by Non value added activities = Time taken for Move Time + Queue Time + Inspection Time
- Calculations:
| Average Time per month (in days) | ||
| Particulars | 4 | 5 |
| Move time per unit | 0.5 | 0.5 |
| Queue Time per unit | 6.7 | 0.0 |
| Inspection Time per unit | 0.6 | 0.6 |
| Total Time For Non Value Added Activities (A) | 7.8 | 1.1 |
| Process Time per unit | 1.8 | 1.8 |
| Total Time For Value Added Activities (B) | 1.8 | 1.8 |
| Throughput Time (A+B) [C] | 9.6 | 2.9 |
| Manufacturing Cycle Efficiency | Time Taken by value added activities / Total Throughput Time. | |
| Manufacturing Cycle Efficiency | 0.19 | 0.62 |
Hence the throughput time and manufacturing cycle efficiency has been calculated for month 5.
3)
b)
Throughput Time, Manufacturing Cycle Efficiency
The time taken from the start of the sale process, i.e. the receipt of a confirmed sales order, to the completion of the transfer of goods or services, i.e. dispatch of goods is known as the Delivery Cycle.
It consists of throughput time, Value added time and non-value added time.
To depict delivery cycle in the formula form, the following formula maybe used:
Delivery Cycle = Value added Elements of Throughput Time + Non Value Added Elements of Throughput Time.
Manufacturing Cycle Efficiency is an internal business performance parameter with respect to manufacturing processes and industries. It measures the total time taken by value added activities in relation to the throughput time.
- Throughput Time for Month 6
- Manufacturing Cycle Efficiency for Month 6
Answer to Problem 19P
Solution:
| Average Time per month (in days) | ||
| Particulars | 4 | 6 |
| Throughput Time | 9.60 | 2.30 |
| Manufacturing Cycle Efficiency for month 6 | 0.19 | 0.78 |
Explanation of Solution
- Throughput time comprises of two main categories of elements i.e. Value added and Non Value added elements.
- Value added elements refer to the time taken for those activities that add quality and value to the overall production process concerning manufacture of goods. Example − Process Time.
- Process time is the time spent on actually producing the product. It refers to the time taken to convert the goods from raw materials to interim or final finished products
- Non Value added elements refer to the time taken for those activities that do not add quality and value to the overall production process concerning manufacture of goods and that need to be eliminated to the greatest extent possible. Example - Inspection Time, Move Time and Queue time
- Inspection time is the amount of time spent assuring that the product is defect free to the best possible extent
- Move time is the time required to transfer raw materials or interim or final finished products from one location to another, such as factory to job workers’ location.
- Queue time is the amount of time that is spent waiting for the actually production activities to commence since other products are being produced or worked upon.
- Given:
| Particulars | 4 | 6 |
| Move time per unit | 0.5 | 0.5 |
| Queue Time per unit | 6.7 | 0.0 |
| Inspection Time per unit | 0.6 | 0.0 |
| Process Time per unit | 1.8 | 1.8 |
- Total Throughput Time = Time Taken by value added activities + Time Taken by Non value added activities (Except Wait Time)
- Manufacturing cycle efficiency = Time Taken by value added activities / Total Throughput Time.
- Time Taken by value added activities = Time taken for Process Time
- Time Taken by Non value added activities = Time taken for Move Time + Queue Time + Inspection Time
- Calculations:
| Average Time per month (in days) | ||
| Particulars | 4 | 6 |
| Move time per unit | 0.5 | 0.5 |
| Queue Time per unit | 6.7 | 0.0 |
| Inspection Time per unit | 0.6 | 0.0 |
| Total Time For Non Value Added Activities (A) | 7.8 | 0.5 |
| Process Time per unit | 1.8 | 1.8 |
| Total Time For Value Added Activities (B) | 1.8 | 1.8 |
| Throughput Time (A+B) [C] | 9.6 | 2.3 |
| Manufacturing Cycle Efficiency | Time Taken by value added activities / Total Throughput Time. | |
| Manufacturing Cycle Efficiency | 0.19 | 0.78 |
Hence the throughput time and manufacturing cycle efficiency has been calculated for month 6.
Want to see more full solutions like this?
Chapter 10 Solutions
Introduction To Managerial Accounting


- Ethics in Action In August, Lannister Company introduced a new performance measurement system in manufacturing operations. One of the new performance measures is lead time, which is determined by tagging a random sample of items with a log sheet throughout the month. The log sheets recorded the time that the sample items started production and the time that they ended production, as well as all steps in between. At the end of the month, the controller collected the log sheets and computed the average lead time of the tagged products. This number was reported to central management and was used to evaluate the performance of the plant manager. Because of the poor lead time results reported for August, the plant was under extreme pressure to reduce lead time in September. The following memo was intercepted by the controller. Date: September 3 To: Hourly Employees From: Plant Manager During last month, you may have noticed that some of the products were tagged with a log sheet. This sheet records the time that a product enters production and the time that it leaves production. The difference between these two times is termed the lead time. Our plant is evaluated on improving lead time. From now on, I ask all of you to keep an eye out for the tagged items. When you see a tagged item, it is to receive special attention. Work on that item first, and then immediately move it to the next operation. Under no circumstances should tagged items wait on any other work that you have. Naturally, report accurate information. I insist that you record the correct times on the log sheet as the product goes through your operations. How should the controller respond to this discovery?arrow_forwardSuspicious Acquisition of Data, Ethical Issues Bill Lewis, manager of the Thomas Electronics Division, called a meeting with his controller, Brindon Peterson, and his marketing manager, Patty Fritz. The following is a transcript of the conversation that took place during the meeting: Bill: Brindon, the variable costing system that you developed has proved to be a big plus for our division. Our success in winning bids has increased, and as a result our revenues have increased by 25%. However, if we intend to meet this years profit targets, we are going to need something extraam I right, Patty? Patty: Absolutely. While we have been able to win more bids, we still are losing too many, particularly to our major competitor, Kilborn Electronics. If we knew more about their bidding strategy, we could be more successful at competing with them. Brindon: Would knowing their variable costs help? Patty: Certainly. It would give me their minimum price. With that knowledge, Im sure that we could find a way to beat them on several jobs, particularly on those jobs where we are at least as efficient. It would also help us to identify where we are not cost competitive. With this information, we might be able to find ways to increase our efficiency. Brindon: Well, I have good news. Ive been talking with Carl Penobscot, Kilborns assistant controller. Carl doesnt feel appreciated by Kilborn and wants to make a change. He could easily fit into our team here. Plus, Carl has been preparing for a job switch by quietly copying Kilborns accounting files and records. Hes already given me some data that reveal bids that Kilborn made on several jobs. If we can come to a satisfactory agreement with Carl, hell bring the rest of the information with him. Well easily be able to figure out Kilborns prospective bids and find ways to beat them. Besides, I could use another accountant on my staff. Bill, would you authorize my immediate hiring of Carl with a favorable compensation package? Bill: I know that you need more staff, Brindon, but is this the right thing to do? It sounds like Carl is stealing those files, and surely Kilborn considers this information confidential. I have real ethical and legal concerns about this. Why dont we meet with Laurie, our attorney, and determine any legal problems? Required: 1. Is Carls behavior ethical? What would Kilborn think? 2. Is Bill correct in supposing that there are ethical and/or legal problems involved with the hiring of Carl? (Reread the section on corporate codes of conduct in Chapter 1.) What would you do if you were Bill? Explain.arrow_forwardCommunications Jamarcus Bradshaw, plant manager of Georgia Paper Companys papermaking mill, was looking over the cost of production reports for July and August for the Papermaking Department. The reports revealed the following: Jamarcus was concerned about the increased cost per ton from the output of the department. As a result, he asked the plant controller to perform a study to help explain these results. The controller, Leann Brunswick, began the analysis by performing some interviews of key plant personnel in order to understand what the problem might be. Excerpts from an interview with Len Tyson, a paper machine operator, follow: Len: We have two papermaking machines in the department. I have no data, but I think paper machine No. 1 is applying too much pulp and, thus, is wasting both conversion and materials resources. We haven't had repairs on paper machine No. 1 in a while. Maybe this is the problem. Leann: How does too much pulp result in wasted resources? Len: Well, you see, if too much pulp is applied, then we will waste pulp material. The customer will not pay for the extra product; we just use more material to make the product. Also, when there is too much pulp, the machine must be slowed down in order to complete the drying process. This results in additional conversion costs. Leann: Do you have any other suspicions? Len: Well, as you know, we have two productsgreen paper and yellow paper. They are identical except for the color. The color is added to the papermaking process in the paper machine. I think that during August these two color papers have been behaving very differently. I don't have any data, but it just seems as though the amount of waste associated with the green paper has increased. Leann: Why is this? Len: I understand that there has been a change in specifications for the green paper, starting near the beginning of August. This change could be causing the machines to run poorly when making green paper. If this is the case, the cost per ton would increase for green paper. Leann also asked for a database printout providing greater detail on Augusts operating results. September 9 Requested by: Leann Brunswick Papermaking DepartmentAugust detail Prior to preparing a report, Leann resigned from Georgia Paper Company to start her own business. You have been asked to take the data that Leann collected, and write a memo to Jamarcus Bradshaw with a recommendation to management. Your memo should include analysis of the August data to determine whether the paper machine or the paper color explains the increase in the unit cost from July. Include any supporting schedules that are appropriate. Round any calculations to the nearest cent.arrow_forward
- Product decisions under bottlenecked operations Mill Metals Inc. has three grades of metal product, Type 5, Type 10, and Type 20. Financial data for the three grades are as follows: Mills operations require all three grades to be melted in a furnace before being formed. The furnace runs 24 hours a day, 7 days a week, and is a production bottleneck. The furnace hours required per unit of each product are as follows: The Marketing Department is considering a new marketing and sales campaign. Which product should be emphasized in the marketing and sales campaign in order to maximize profitability?arrow_forwardCost Separation About 8 years ago, Kicker faced the problem of rapidly increasing costs associated with workplace accidents. The costs included the following: A safety program was implemented with the following features: hiring a safety director, new employee orientation, stretching required four times a day, and systematic monitoring of adherence to the program by directors and supervisors. A year later, the indicators were as follows: Required: 1. CONCEPTUAL CONNECTION Discuss the safety-related costs listed. Are they variable or fixed with respect to speakers sold? With respect to other independent variables (describe)? 2. CONCEPTUAL CONNECTION Did the safety program pay for itself? Discuss your reasoning.arrow_forwardSuppose that Kicker had the following sales and cost experience (in thousands of dollars) for May of the current year and for May of the prior year: In May of the prior year, Kicker started an intensive quality program designed to enable it to build original equipment manufacture (OEM) speaker systems for a major automobile company. The program was housed in research and development. In the beginning of the current year, Kickers accounting department exercised tighter control over sales commissions, ensuring that no dubious (e.g., double) payments were made. The increased sales in the current year required additional warehouse space that Kicker rented in town. (Round ratios to four decimal places. Round sales dollars computations to the nearest dollar.) Required: 1. Calculate the contribution margin ratio for May of both years. 2. Calculate the break-even point in sales dollars for both years. 3. Calculate the margin of safety in sales dollars for both years. 4. CONCEPTUAL CONNECTION Analyze the differences shown by your calculations in Requirements 1, 2, and 3.arrow_forward
- At the end of 20x1, Mejorar Company implemented a low-cost strategy to improve its competitive position. Its objective was to become the low-cost producer in its industry. A Balanced Scorecard was developed to guide the company toward this objective. To lower costs, Mejorar undertook a number of improvement activities such as JIT production, total quality management, and activity-based management. Now, after two years of operation, the president of Mejorar wants some assessment of the achievements. To help provide this assessment, the following information on one product has been gathered: Required: 1. Compute the following measures for 20x1 and 20x3: a. Actual velocity and cycle time b. Percentage of total revenue from new customers (assume one unit per customer) c. Percentage of very satisfied customers (assume each customer purchases one unit) d. Market share e. Percentage change in actual product cost (for 20x3 only) f. Percentage change in days of inventory (for 20x3 only) g. Defective units as a percentage of total units produced h. Total hours of training i. Suggestions per production worker j. Total revenue k. Number of new customers 2. For the measures listed in Requirement 1, list likely strategic objectives, classified according to the four Balance Scorecard perspectives. Assume there is one measure per objective.arrow_forwardCMA-ADAPTED PERFORMANCE MEASURES The Star Paper Division of Royal Industries is located near Los Angeles. A major expansion of the divisions only plant was completed in April 2015. The expansion consisted of an addition to the existing building, additions to the production line machinery, and the replacement of obsolete and fully depreciated equipment that was no longer efficient or cost-effective. On May 1, 2015, George Harris became manager of Star. Harris had a meeting with Marie Fortner, vice president of operations for Royal, who explained to Harris that the company measured the performance of divisions and division managers on the basis of return on gross assets (ROA). When Harris asked if other measures were used in conjunction with ROA, Fortner replied, Royals top management prefers to use a single performance measure. Star should do well this year now that it has expanded and replaced all of that old equipment. You should have no problem exceeding the divisions historical rate. Ill check with you at the end of each quarter to see how you are doing. Fortner called Harris after the first quarter results were completed because Stars ROA was considerably below the historical rate for the division. Harris told Fortner that he did not believe that ROA was a valid performance measure for Star. Fortner indicated that she would discuss this with others at headquarters and get back to Harris. However, there was no further discussion of the use of ROA but only reports on divisional performance at the end of the second and third quarters. Now that the fiscal year has ended, Harris has received the memorandum in the figure designated for Problem 14. PROBLEM 14: PERFORMANCE MEASURES TO: George Harris, Star Paper Division FROM: Marie Fortner, Royal Industries SUBJECT: Divisional Performance The operating results for the fourth quarter and for our fiscal year ended on April 30 are now complete. Your fourth quarter return on gross assets was only 9 percent, resulting in a return for the year of slightly under 11 percent. I recall discussing your low return after the first quarter and reminding you after the second and third quarters that this level of return is not considered adequate for the Star Paper Division. The return on gross assets at Star has ranged from 15 to 18 percent for the past five years. An 11 percent return may be acceptable at some of Royals other divisions, but not at a proven winner like Star, especially in light of your recently improved facility. Please arrange to meet with me in the near future to discuss ways to restore Stars return on gross assets to its former level. Harris is looking forward to meeting with Fortner as he plans to pursue the discussion about the appropriateness of ROA as a performance measure for Star. While the ROA for Star is below historical levels, the divisions profits for the year are higher than at any previous time. Harris is going to recommend that ROA be replaced with multiple criteria for evaluating performancenamely, dollar profit, receivable turnover, and inventory turnover. Required a. Identify general criteria that should be used in selecting performance measures to evaluate operating managers. b. Describe the probable cause of the decline in the Star Paper Divisions return on gross assets during the fiscal year ended April 30, 2007. c. On the basis of the relationship between Fortner and Harris, as well as the memorandum from Fortner, discuss apparent weaknesses in the performance evaluation process at Royal Industries. d. Discuss whether the multiple performance evaluation criteria that Harris suggested would be appropriate for the evaluation of the Star Paper Division.arrow_forwardIn 20x5, Major Company initiated a full-scale, quality improvement program. At the end of the year, Jack Aldredge, the president, noted with some satisfaction that the defects per unit of product had dropped significantly compared to the prior year. He was also pleased that relationships with suppliers had improved and defective materials had declined. The new quality training program was also well accepted by employees. Of most interest to the president, however, was the impact of the quality improvements on profitability. To help assess the dollar impact of the quality improvements, the actual sales and the actual quality costs for 20x4 and 20x5 are as follows by quality category: All prevention costs are fixed (by discretion). Assume all other quality costs are unit-level variable. Required: 1. Compute the relative distribution of quality costs for each year and prepare a pie chart. Do you believe that the company is moving in the right direction in terms of the balance among the quality cost categories? Explain. 2. Prepare a one-year trend performance report for 20x5 (compare the actual costs of 20x5 with those of 20x4, adjusted for differences in sales volume). How much have profits increased because of the quality improvements made by Major Company? 3. Estimate the additional improvement in profits if Major Company ultimately reduces its quality costs to 2.5 percent of sales revenues (assume sales of 10 million).arrow_forward
- Lindell Manufacturing embarked on an ambitious quality program that is centered on continual improvement. This improvement is operationalized by declining quality costs from year to year. Lindell rewards plant managers, production supervisors, and workers with bonuses ranging from 1,000 to 10,000 if their factory meets its annual quality cost goals. Len Smith, manager of Lindells Boise plant, felt obligated to do everything he could to provide this increase to his employees. Accordingly, he has decided to take the following actions during the last quarter of the year to meet the plants budgeted quality cost targets: a. Decrease inspections of the process and final product by 50% and transfer inspectors temporarily to quality training programs. Len believes this move will increase the inspectors awareness of the importance of quality; also, decreasing inspection will produce significantly less downtime and less rework. By increasing the output and decreasing the costs of internal failure, the plant can meet the budgeted reductions for internal failure costs. Also, by showing an increase in the costs of quality training, the budgeted level for prevention costs can be met. b. Delay replacing and repairing defective products until the beginning of the following year. While this may increase customer dissatisfaction somewhat, Len believes that most customers expect some inconvenience. Besides, the policy of promptly dealing with customers who are dissatisfied could be reinstated in 3 months. In the meantime, the action would significantly reduce the costs of external failure, allowing the plant to meet its budgeted target. c. Cancel scheduled worker visits to customers plants. This program, which has been very well received by customers, enables Lindell workers to see just how the machinery they make is used by the customer and also gives them first-hand information on any remaining problems with the machinery. Workers who went on previous customer site visits came back enthusiastic and committed to Lindells quality program. Lindells quality program staff believes that these visits will reduce defects during the following year. Required: 1. Evaluate Lens ethical behavior. In this evaluation, consider his concern for his employees. Was he justified in taking the actions described? If not, what should he have done? 2. Assume that the company views Lens behavior as undesirable. What can the company do to discourage it? 3. Assume that Len is a CMA and a member of the IMA. Refer to the ethical code for management accountants in Chapter 1. Were any of these ethical standards violated?arrow_forwardIn 20X1, Don Blackburn, president of Price Electronics, received a report indicating that quality costs were 31% of sales. Faced with increasing pressures from imported goods. Don resolved to take measures to improve the overall quality of the companys products. After hiring a consultant in 20X1, the company began an aggressive program of total quality control. At the end of 20X5, Don requested an analysis of the progress the company had made in reducing and controlling quality costs. The accounting department assembled the following data: Required: 1. Compute the quality costs as a percentage of sales by category and in total for each year. 2. Prepare a multiple-year trend graph for quality costs, both by total costs and by category. Using the graph, assess the progress made in reducing and controlling quality costs. Does the graph provide evidence that quality has improved? Explain. 3. Using the 20X1 quality cost relationships (assume all costs are variable), calculate the quality costs that would have prevailed in 20X4. By how much did profits increase in 20X4 because of the quality improvement program? Repeat for 20X5.arrow_forwardJoseph Fox, controller of Thorpe Company, has been in charge of a project to install an activity-based cost management system. This new system is designed to support the companys efforts to become more competitive. For the past six weeks, he and the project committee members have been identifying and defining activities, associating workers with activities, and assessing the time and resources consumed by individual activities. Now, he and the project committee are focusing on three additional implementation issues: (1) identifying activity drivers, (2) assessing value content, and (3) identifying cost drivers (root causes). Joseph has assigned a committee member the responsibilities of assessing the value content of five activities, choosing a suitable activity driver for each activity, and identifying the possible root causes of the activities. Following are the five activities with possible activity drivers: The committee member ran a regression analysis for each potential activity driver, using the method of least squares to estimate the variable and fixed cost components. In all five cases, costs were highly correlated with the potential drivers. Thus, all drivers appeared to be good candidates for assigning costs to products. The company plans to reward production managers for reducing product costs. Required: 1. What is the difference between an activity driver and a cost driver? In answering the question, describe the purpose of each type of driver. 2. For each activity, assess the value content and classify each activity as value-added or non-value-added (justify the classification). Identify some possible root causes of each activity, and describe how this knowledge can be used to improve activity performance. For purposes of discussion, assume that the value-added activities are not performed with perfect efficiency. 3. Describe the behavior that each activity driver will encourage, and evaluate the suitability of that behavior for the companys objective of becoming more competitive.arrow_forward
 Managerial AccountingAccountingISBN:9781337912020Author:Carl Warren, Ph.d. Cma William B. TaylerPublisher:South-Western College Pub
 Cornerstones of Cost Management (Cornerstones Ser...AccountingISBN:9781305970663Author:Don R. Hansen, Maryanne M. MowenPublisher:Cengage Learning
 Managerial Accounting: The Cornerstone of Busines...AccountingISBN:9781337115773Author:Maryanne M. Mowen, Don R. Hansen, Dan L. HeitgerPublisher:Cengage Learning
 Financial And Managerial AccountingAccountingISBN:9781337902663Author:WARREN, Carl S.Publisher:Cengage Learning,
 Auditing: A Risk Based-Approach (MindTap Course L...AccountingISBN:9781337619455Author:Karla M Johnstone, Audrey A. Gramling, Larry E. RittenbergPublisher:Cengage Learning
 Accounting Information SystemsAccountingISBN:9781337619202Author:Hall, James A.Publisher:Cengage Learning,