Essentials Of Investments
11th Edition
ISBN: 9781260013924
Author: Bodie, Zvi, Kane, Alex, MARCUS, Alan J.
Publisher: Mcgraw-hill Education,
expand_more
expand_more
format_list_bulleted
Question
2) Ratios
Based on the information given in picture #1, complete the following ratios for the last TWO years and indicate whether the trend is favorable or unfavorable. Note percentages and times should be to one decimal place (e.g. 14.8%; 5.8x)
Liq./Solv. Ratios Current Yr. Prior Yr. Fav/Unfav.
Current Ratio (X)
{Total. Current Assets/
Total Current Liabilities}
Quick Ratio (X)
{Cash + Short term Investments +
Current Receivables/ Current Liabilities}
Day's Sales Uncollected (days)
{Total Accounts Receivables / Sales x 365}

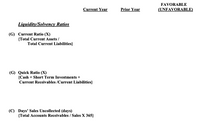
Transcribed Image Text:FAVORABLE
Current Year
Prior Year
(UNFAVORABLE)
Liquidity/Solvency Ratios
(G) Current Ratio (X)
{Total Current Assets /
Total Current Liabilities}
(G) Quick Ratio (X)
{Cash + Short Term Investments +
Current Receivables /Current Liabilities}
(C) Days' Sales Uncollected (days)
{Total Accounts Receivables / Sales X 365}

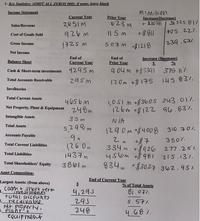
Transcribed Image Text:1- Key Statistics: (OMIT ALL ZEROS 000): if none, leave blank
Income Statement
Prior Year
623 M
Current Year
Increase(Decrease)
2651M
+ £2028
% 325.81%.
Sales/Revenue
926m
705.22%.
Cost of Goods Sold
1725 M
507m m$1218
239.571.
Gross Income
Net Income
End of
Increase (Decrease)
S.
End of
Balance Sheet
Current Year
Prior Year
4295M
9 04 m +$339l 375.17
Cash & Short-term investments
Total Accounts Receivable
295M
145.837.
120m +$175
Invehtories
1,OSIM 360s 343.01%.
126m rý122 96.83%.
Total Current Assets
4656m
Net Property, Plant & Equipment 24 8m
Intangible Assets
35M
N IA
Total Assets
5,298M
129 0m tf4008 310.701.
Accounts Payable
3507.
Total Current Liabilities
126 0m
1437m
334 m r926 277.25.
456m 9 215.13%.
834m 3027 362.951.
Total Liabilities
Total Shareholders' Equity
3861 m
*$3027
Asset Composition:
End of Current Year
Largest Assets: (from above)
Cah + short term
nrestments
tutal accounts
e_receivable
ret property,
% of Total Assets
4,295
295
248
81.077.
S. 57%.
Plaht'i
equip ment
4.68 7.
Expert Solution
This question has been solved!
Explore an expertly crafted, step-by-step solution for a thorough understanding of key concepts.
Step by stepSolved in 2 steps with 1 images

Knowledge Booster
Learn more about
Need a deep-dive on the concept behind this application? Look no further. Learn more about this topic, finance and related others by exploring similar questions and additional content below.Similar questions
- Current Position Analysis The following data were taken from the balance sheet of Nilo Company at the end of two recent fiscal years: Current Year Previous Year Current assets: Cash Marketable securities Accounts and notes receivable (net) Inventories Prepaid expenses Total current assets Current liabilities: Accounts and notes payable (short-term) Accrued liabilities Total current liabilities a. Determine for each year (1) the working Current Year 1. Working capital 2. Current ratio 3. Quick ratio b. The liquidity of Nilo has current assets relative to current liabilities. $690,500 799,500 327,000 1,042,800 537,200. $3,397,000 $458,200 $579,600 652,100 217,300 673,400 430,600 $2,553,000 $483,000 331,800 207,000 $790,000 $690,000 capital, (2) the current ratio, and (3) the quick ratio. Round ratios to one decimal place. Previous Year from the preceding year to the current year. The working capital, current ratio, and quick ratio have all . Most of these changes are the result of an inarrow_forwardVertical Analysis of Balance Sheet Balance sheet data for a company for the years ended December 31, 20Y2 and 20Y1, are shown below. 20Y2 20Υ1 Current assets $ 752,000 $ 602,000 Property, plant, and equipment 6,248,000 5,397,000 Intangible assets 1,000,000 1,001,000 Current liabilities 504,000 427,000 Long-term liabilities 1,504,000 1,197,000 Common stock 1,248,000 1,253,000 Retained earnings 4,744,000 4,123,000 | Prepare a comparative balance sheet for 20Y2 and 20Y1, stating each asset as a percent of total assets and each liability and stockholders' equity item as a percent of the total liabilities and stockholders' equity. Round your answers to one decimal place. Comparative Balance Sheet December 31, 20Y2 and 20Y1 20Y2 Amount 20Y2 Percent 20Y1 Amount 20Y1 Percent Assets Current assets $752,000 % $602,000 % Property, plant, and equipment 6,248,000 5,397,000 Intangible assets 1,000,000 1,001,000arrow_forward2) Ratios Based on the information given in picture #1, complete the following ratios for the last TWO years and indicate whether the trend is favorable or unfavorable. Note percentages and times should be to one decimal place (e.g. 14.8%; 5.8x) Profitability Ratios Current Yr. Prior Yr. Fav/Unfav. Gross Margin (%) {Gross Income/Sales Revenue} Profit Margin (%) {Net income/ Sales Revenue} Return on Assets (%) {Net Income/ Average Total Assets}arrow_forward
- 2) Ratios Based on the information given in picture #1, complete the following ratios for the last TWO years and indicate whether the trend is favorable or unfavorable. Note percentages and times should be to one decimal place (e.g. 14.8%; 5.8x) Liq./Solv. Ratios Current Yr. Prior Yr. Fav/Unfav. Current Ratio (X) {Total. Current Assets/ Total Current Liabilities} Quick Ratio (X) {Cash + Short term Investments + Current Receivables/ Current Liabilities} Day's Sales Uncollected (days) {Total Accounts Receivables / Sales x 365}arrow_forwardN1. Account Calculate the following ratios for Lake of Egypt Marina, Inc. as of year-end 2021. (Use sales when computing the inventory turnover and use total stockholders' equity when computing the equity multiplier. Round your answers to 2 decimal places. Use 365 days a year.)arrow_forwardRequired: 1. Complete the following columns for each item in the comparative financial statements (Negative answers shoul be indicated by a minus sign. Round percentage answers to 2 decimal places, i.e., 0.1243 should be entered as 12.43.): Increase (Decrease) Year 2 over Year 1 Amount Percentage Statement of earnings: Sales revenue Cost of sales Gross margin Operating expenses and interest expense Earnings before income taxes Income tax expense Net earnings $ 45,770 38,650 7,120 4,020 3,100 1,050 $ 2,050 Statement of financial position: Cash (4,720) Accounts receivable (net) (4,220) Inventory 6,200 Property, plant, and equipment (net) 6,380 $ 3,640 Current liabilities (3,840) Long-term debt 3,530 Common shares 0 Retained earnings 3,950 $ 3,640arrow_forward
- please answer within the format by providing formula the detailed workingPlease provide answer in text (Without image)Please provide answer in text (Without image)Please provide answer in text (Without image)arrow_forwardPlease fill out vertical analysis of this balance sheet to determine component percentage of assets liabilities and stockholders equity based on data. Round percentages to the nearest hundredths percentarrow_forwardAccounting Questionarrow_forward
- Indicate the effect of the transactions listed in the following table on total current assets, current ration, and net income. Use (+) to indicate an increase, (-) to indicate a decrease, and (0) to indicate either no effect or an indeterminate effect. Be prepared to state any necessary assumptions and assume an initial current ratio of more than 1.0. Federal income tax due for the previous year is paid.arrow_forwardExamine the selected data over the 5-year period as shown in the table below for Dumbledore Ltd. Item Sales Cost of sales EBIT Interest NPAT Current assets Total assets current liabilities Total liabilities Equity Gross margin Interest coverage Current ratio 2021 $m 286.41 180.03 51.18 37.07 35.13 43.85 226.18 55.99 98.99 127.19 0.37 1.38 0.78 Year 2020 $m 280.80 166.69 51.08 33.70 35.10 43.20 221.75 53.58 91.66 130.09 0.41 1.52 0.81 2019 $m 275.29 154.35 50.98 30.64 35.06 42.56 217.40 51.27 84.87 132.53 0.44 1.66 0.89 2018 $m 269.89 142.91 50.88 27.85 35.03 41.93 213.13 49.06 78.58 134.56 0.47 1.83 U.OJ 2017 $m 264.60 134.19 49.88 25.32 34.51 41.31 206.93 47.40 74.48 132.44 0.49 1.97 0.87 2016 $m 252.00 126.00 48.90 24.00 34.00 40.70 200.90 45.80 70.60 130.30 0.50 2.04 0.89arrow_forwardPlease do not give image format and explanationarrow_forward
arrow_back_ios
SEE MORE QUESTIONS
arrow_forward_ios
Recommended textbooks for you
 Essentials Of InvestmentsFinanceISBN:9781260013924Author:Bodie, Zvi, Kane, Alex, MARCUS, Alan J.Publisher:Mcgraw-hill Education,

 Foundations Of FinanceFinanceISBN:9780134897264Author:KEOWN, Arthur J., Martin, John D., PETTY, J. WilliamPublisher:Pearson,
 Fundamentals of Financial Management (MindTap Cou...FinanceISBN:9781337395250Author:Eugene F. Brigham, Joel F. HoustonPublisher:Cengage Learning
 Corporate Finance (The Mcgraw-hill/Irwin Series i...FinanceISBN:9780077861759Author:Stephen A. Ross Franco Modigliani Professor of Financial Economics Professor, Randolph W Westerfield Robert R. Dockson Deans Chair in Bus. Admin., Jeffrey Jaffe, Bradford D Jordan ProfessorPublisher:McGraw-Hill Education

Essentials Of Investments
Finance
ISBN:9781260013924
Author:Bodie, Zvi, Kane, Alex, MARCUS, Alan J.
Publisher:Mcgraw-hill Education,


Foundations Of Finance
Finance
ISBN:9780134897264
Author:KEOWN, Arthur J., Martin, John D., PETTY, J. William
Publisher:Pearson,

Fundamentals of Financial Management (MindTap Cou...
Finance
ISBN:9781337395250
Author:Eugene F. Brigham, Joel F. Houston
Publisher:Cengage Learning

Corporate Finance (The Mcgraw-hill/Irwin Series i...
Finance
ISBN:9780077861759
Author:Stephen A. Ross Franco Modigliani Professor of Financial Economics Professor, Randolph W Westerfield Robert R. Dockson Deans Chair in Bus. Admin., Jeffrey Jaffe, Bradford D Jordan Professor
Publisher:McGraw-Hill Education