FINANCIAL ACCOUNTING
10th Edition
ISBN: 9781259964947
Author: Libby
Publisher: MCG
expand_more
expand_more
format_list_bulleted
Question
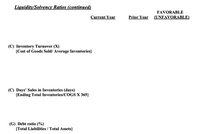
2) Ratios
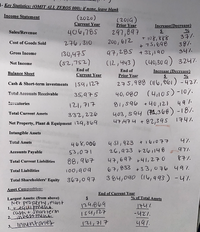
Based on the information given in picture #1, complete the following ratios for the last TWO years and indicate whether the trend is favorable or unfavorable. Note percentages and times should be to one decimal place (e.g. 14.8%; 5.8x)
Liq./Solv. Ratios Current Yr. Prior Yr. Fav/Unfav.
Inventory Turnover (X)
{Cost of Goods Sold/
Average Inventories}
Day's Sales in Inventories (days)
{Ending Total Inventories/
Cost of Goods Sold x 365}
Debt Ratio (%)
{Total Liabilities / Total Assets }

Transcribed Image Text:Liguidity/Solvency Ratios (continued)
FAVORABLE
Current Year
Prior Year
(UNFAVORABLE)
(C) Inventory Turnover (X)
{Cost of Goods Sold/ Average Inventories}
(C) Days' Sales in Inventories (days)
{Ending Total Inventories/COGS X 365}
(G) Debt ratio (%)
{Total Liabilities / Total Assets}

Transcribed Image Text:1- Key Statistices: (OMIT ALL ZEROS 000); if none, leave blank
Income Statement
(2020)
Current Year
406,785
(201G)
Prior Year
Increase(Decrease)
Sales/Revenue
297,897
T 108, 888
+ 75,698
97,285 + 33,190
(12,443) (40,30 a) 3247.
37/-
387.
347
276,310
200, 612
Cost of Goods Sold
130,475
(s2,752)
Gross Income
Net Income
Balance Sheet
End of
Current Year
End of
Increase (Decrease)
Prior Year
275,988 (116, 061) -42%.
40, 080 (410s)-10%.
40,121 491.
Cash & Short-term investments
|59,127
Total Accounts Reccivable
35,975
veatories
12, 귀구
81,596
332, 226
Net Property, Plant & Equipment 129,869
403, 594 (74,366) -18/.
47/47 니 +82,39S 1747.
Total Current Assets
Intangible Assets
4 SI, 923 +i br077 4%
26,923 + 261148
4구,697 +41, 2구 0
67,833 +3 3,076 497
384,090 (14,993) -47.
Total Assets
46४,००6
977.
Accounts Payable
53,071
877.
88,967
Total Current Liabilities
Total Linbilities
100,90a
Total Shareholders' Equity
36구,097
Asset Compoition:
End of Current Year
% of Total Assets
Largest Assets: (from above)
Net property ,Plant
1. tequipmeAAA
casn + Snort term
2.iA Amen
129869
I54,127
-42%.
491.
3. Innentoriey
12/,717
Expert Solution
This question has been solved!
Explore an expertly crafted, step-by-step solution for a thorough understanding of key concepts.
Step by stepSolved in 2 steps

Knowledge Booster
Learn more about
Need a deep-dive on the concept behind this application? Look no further. Learn more about this topic, accounting and related others by exploring similar questions and additional content below.Similar questions
- 1. Given this information, what is the profit percent? Format your answer to two decimal places and add a %-sign (i.e. 4.52%) Net Sales $561,800 Cost of Goods Sold 275,280 Expenses 253,936 2. Given this information, what is the profit dollars? Round your answer to the dollar and add a dollar sign and comma separator (i.e. $15,467) Net Sales $561,800 Cost of Goods Sold 275,280 Expenses 253,936 3. Given the information below, what is the profit dollars? Round your answer to the dollar and add a dollar sign and comma separator (i.e. $15,467) Gross Sales $341,420 Customer Returns 29,870 Cost of Goods Sold 161,570 Expenses 138,140 4. Given the information below, what is the profit percent? Round your answer to two decimal places and add a percent sign (i.e. 15.37%) Gross Sales $341,420 Customer Returns 29,870 Cost of Goods Sold 161,570 Expenses 138,140 5. Given the information below, what are…arrow_forward1. Inventory turnover is calculated as __________ divided by __________. cost of goods sold; inventory cost of goods sold; average inventory cost of goods sold; total assets average inventory; cost of goods sold 2. The number of days’ sales in inventory is calculated as __________ divided by __________. average inventory; average daily cost of goods sold ending inventory; cost of goods sold net income; sales cost of goods sold; average inventoryarrow_forwardSelected current year-end financial statements of Cabot Corporation follow. (All sales were on credit; selected balance sheet amounts at December 31 of the prior year were inventory, $52,900; total assets, $219,400; common stock, $86,000; and retained earnings, $31,757.) Assets Cash Short-term investments Accounts receivable, net Merchandise inventory. Prepaid expenses Plant assets, net Total assets CABOT CORPORATION Income Statement For Current Year Ended December 31 Sales Cost of goods sold Gross profit $ 14,000 8,200 30,000 38,150 2,600 149,300 $ 242, 250 Operating expenses Interest expense Income before taxes Income tax expense Net income $ 456,600 297,750 158,850 99,000 4,600 55,250 22,257 $32,993 CABOT CORPORATION Balance Sheet December 31 of current year Liabilities and Equity Accounts payable Accrued wages payable Income taxes payable Long-term note payable, secured by mortgage on plant assets Common stock Retained earnings Total liabilities and equity $ 18,500 3,600 4,000…arrow_forward
- Problem 17-2A (Algo) Ratios, common-size statements, and trend percents LO P1, [The following information applies to the questions displayed below.] Selected comparative financial statements of Korbin Company follow. KORBIN COMPANY Comparative Income Statements. For Years Ended December 31 2021 Sales: Cost of goods sold Gross profit Selling expenses Administrative expenses Total expenses Income before taxes Income tax expense Net income Assets Current assets 2020 $436,580 $ 334,456 262,821 173,759 61,994 39,292 Long-term investments Plant assets, net Total assets KORBIN COMPANY Comparative Balance Sheets December 31 Liabilities and Equity Current liabilities Common stock Other paid-in capital Retained earnings Total liabilities and equity 212,045 122,411 46, 155 101,286 72,473 13,480 $ 58,993 $ 37,225 29,432 75,587 46,824 9,599 2021 $ 54,789 0 100, 200 $154,989 $ 22,628 72,000 9,000 51,361 2019 $ 232,100 148,544 83,556 30,637 19,264 49,901 33,655 6,832 $ 26,823 2020 $36,670 900 91,178…arrow_forwardCompute common-size percents for the following comparative income statements (round percents to one decimal). Using the common-size percents, which item is most responsible for the decline in net income?arrow_forwardDetermine the Prior Year and Current Year common-size percents for cost of goods sold using net sales as the base. ( answers in thousands of dollars.) ($ thousands) Net sales Cost of goods sold Current Year: Prior Year: Prior Current Year $801,810 $ 453,000 Year: 392,887 134,088 Common-Size Percent for Cost of Goods Sold using Net Sales as the base: Choose Denominator: Base year net sales 801,810/ $ 453,000/ $ Choose Numerator: Analysis period net sales S S 453,000= 453,000 = Common-size percents 177.0 % 100.0 %arrow_forward
- 2) Ratios Based on the information given in picture #1, complete the following ratios for the last TWO years and indicate whether the trend is favorable or unfavorable. Note percentages and times should be to one decimal place (e.g. 14.8%; 5.8x) Profitability Ratios Current Yr. Prior Yr. Fav/Unfav. Gross Margin (%) {Gross Income/Sales Revenue} Profit Margin (%) {Net income/ Sales Revenue} Return on Assets (%) {Net Income/ Average Total Assets}arrow_forwardRequired: 1. Complete the following columns for each item in the comparative financial statements (Negative answers shoul be indicated by a minus sign. Round percentage answers to 2 decimal places, i.e., 0.1243 should be entered as 12.43.): Increase (Decrease) Year 2 over Year 1 Amount Percentage Statement of earnings: Sales revenue Cost of sales Gross margin Operating expenses and interest expense Earnings before income taxes Income tax expense Net earnings $ 45,770 38,650 7,120 4,020 3,100 1,050 $ 2,050 Statement of financial position: Cash (4,720) Accounts receivable (net) (4,220) Inventory 6,200 Property, plant, and equipment (net) 6,380 $ 3,640 Current liabilities (3,840) Long-term debt 3,530 Common shares 0 Retained earnings 3,950 $ 3,640arrow_forward8arrow_forward
- Following is an incomplete current-year income statement. Determine Net Sales, Cost of goods sold and Net Income. Additional information follows: Return on total assets is 16% (average total assets is $62,500). Inventory turnover is 5 (average inventory is $7,800). Accounts receivable turnover is 8 (average accounts receivable is $7,700). Income Statement Net Sales Cost of goods sold Selling, general, and administrative expenses 8800 Income tax expenses 3800 Net Incomearrow_forwardPlease help. Thanksarrow_forwardExpress the following comparative income statements in common-size percents. C esponsible for the decline in net income? Complete this question by entering your answers in the tabs below. Income Statement Reason for Decline in Net Income Express the following comparative income statements in common-size percents. Note: Round your percentage answers to 1 decimal place. Sales Cost of goods sold Gross profit Operating expenses Net Income GOMEZ CORPORATION Comparative Income Statements For Years Ended December 31 Current Year % 100.0 Current Year S $ $ 740,000 568,100 171,900 128,000 43,900 Prior Year $ $ $ 690,000 291,000 399,000 226,400 172,600 Prior Year % Reason for Decline in Not Ingarrow_forward
arrow_back_ios
SEE MORE QUESTIONS
arrow_forward_ios
Recommended textbooks for you

 AccountingAccountingISBN:9781337272094Author:WARREN, Carl S., Reeve, James M., Duchac, Jonathan E.Publisher:Cengage Learning,
 Accounting Information SystemsAccountingISBN:9781337619202Author:Hall, James A.Publisher:Cengage Learning,
 Horngren's Cost Accounting: A Managerial Emphasis...AccountingISBN:9780134475585Author:Srikant M. Datar, Madhav V. RajanPublisher:PEARSON
 Intermediate AccountingAccountingISBN:9781259722660Author:J. David Spiceland, Mark W. Nelson, Wayne M ThomasPublisher:McGraw-Hill Education
 Financial and Managerial AccountingAccountingISBN:9781259726705Author:John J Wild, Ken W. Shaw, Barbara Chiappetta Fundamental Accounting PrinciplesPublisher:McGraw-Hill Education


Accounting
Accounting
ISBN:9781337272094
Author:WARREN, Carl S., Reeve, James M., Duchac, Jonathan E.
Publisher:Cengage Learning,

Accounting Information Systems
Accounting
ISBN:9781337619202
Author:Hall, James A.
Publisher:Cengage Learning,

Horngren's Cost Accounting: A Managerial Emphasis...
Accounting
ISBN:9780134475585
Author:Srikant M. Datar, Madhav V. Rajan
Publisher:PEARSON

Intermediate Accounting
Accounting
ISBN:9781259722660
Author:J. David Spiceland, Mark W. Nelson, Wayne M Thomas
Publisher:McGraw-Hill Education

Financial and Managerial Accounting
Accounting
ISBN:9781259726705
Author:John J Wild, Ken W. Shaw, Barbara Chiappetta Fundamental Accounting Principles
Publisher:McGraw-Hill Education