
FINANCIAL ACCOUNTING
10th Edition
ISBN: 9781259964947
Author: Libby
Publisher: MCG
expand_more
expand_more
format_list_bulleted
Related questions
Question
Instructions:
I. Resolve the ratios listed on table a for each year (2020 & 2021):
a. For each ratio includes the formula with math computes (2020 & 2021)
b. . Fill M&G Industries Ratio Analysis Table A. (2020 & 2021)
II. Perform the following Analysis:
a. Explain each ratio results for 2021 only.
b. Compare each ratio performance with the previous year results (compare 2021 results with 2020 results)
c. Compare each Ratio results for 2021 with their respective Industry average.
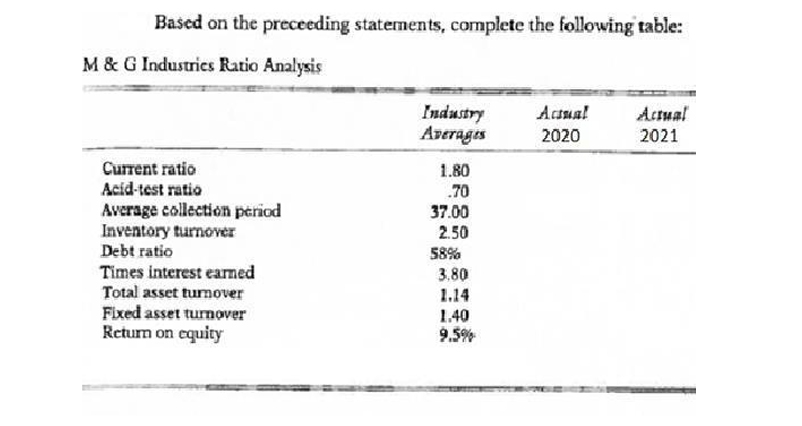

Transcribed Image Text:Based on the preceeding statements, complete the following table:
M & G Industries Ratio Analysis
Industry
Averagis
Acaua!
Actual
2020
2021
Current ratio
Acid-test ratio
Average collection period
Inventory turnover
Debt ratio
Times interest earmed
Total asset turnover
Fixed asset turnover
Return on equity
1.80
.70
37.00
2.50
58%
3.80
1.14
1.40
9.5%

Transcribed Image Text:Analysis of Financial Statements (Financial Ratios)
M & G Industries Balance Sheet
For December 31, 2020 and 2021
2020
2021
Cash
Accounts receivable
Inventories
Total current asseis
Land
$ 9,000
12,500
29,000
$ 50,500
20,000
500
16,000
45,500
$ 62,000
26,000
100,000
Buildings and equipment
Less: allowance for depreciation
Total fixed assets
Total assets
70,000
(28,000)
$ 62,000
$112,500
$ 10,500
17,000
$ 27,500
28,750
31,500
24,750
$112,500
(38,000)
$ 88,000
$150,000
$ 22,000
47,000
$ 69,000
22,950
31,500
26,550
$150,000
Accounts Payable
Short-term bank notes
Total current liabilities
Long-term debt
Common stock
Retained earnings
Total debt and equity
M&G Industries Income Statement
For the Years Ended December 31, 2020 and 2021
2020
2021
Sales (all credit)
Cost of goods sold
Gross profit
Operating expenses
Fixed cash operating expenses
Variable operating expenses
Depreciation
Total operating expenses
Earnings before interest and taxes
Interest expense
Earnings before taxes
Талеs
$125,000
75,000
50,000
$160,000
96,000
$ 64,000
$ 21,000
12,500
$ 21,000
16,000
4,500
$ 38,000
$ 12,000
3,000
$ 9,000
4,500
$ 4,500
10,000
$ 47,000
$ 17,000
6,100
$ 10,900
5,450
$ 5,450
Net income
Expert Solution
This question has been solved!
Explore an expertly crafted, step-by-step solution for a thorough understanding of key concepts.

Step by stepSolved in 5 steps with 1 images

Knowledge Booster


Learn more about
Need a deep-dive on the concept behind this application? Look no further. Learn more about this topic, accounting and related others by exploring similar questions and additional content below.Similar questions
- Locate the formula in the textbook and calculate the 2022 Profit Margin Ratio (Profitability). Fill in the numerator and denominator using the financial statements provided (no symbols or commas) and the answer should be in a XX.XX% format:arrow_forwardplease answer within the format by providing formula the detailed workingPlease provide answer in text (Without image)Please provide answer in text (Without image)Please provide answer in text (Without image)arrow_forward2) Ratios Based on the information given in picture #1, complete the following ratios for the last TWO years and indicate whether the trend is favorable or unfavorable. Note percentages and times should be to one decimal place (e.g. 14.8%; 5.8x) Liq./Solv. Ratios Current Yr. Prior Yr. Fav/Unfav. Current Ratio (X) {Total. Current Assets/ Total Current Liabilities} Quick Ratio (X) {Cash + Short term Investments + Current Receivables/ Current Liabilities} Day's Sales Uncollected (days) {Total Accounts Receivables / Sales x 365}arrow_forward
- Perform the following: a. horizontal analysis b. vertical analysis c. ratio analysis d. interpret the resultsarrow_forwardplease answer within the format by providing formula the detailed workingPlease provide answer in text (Without image)Please provide answer in text (Without image)Please provide answer in text (Without image)arrow_forwardThe financial statements of Dandy Distributors Ltd. are shown on the "Fcl. Stmts." page. 1 Based on Dandy's financial statements, calculate ratios for the year ended December 31, 2020. Assume all sales are on credit. Show your work. 2 From these ratios, analyze the financial performance of Dandy.arrow_forward
- please answer within the format by providing formula the detailed workingPlease provide answer in text (Without image)Please provide answer in text (Without image)Please provide answer in text (Without image)arrow_forwardPlease do not give solution in image format thankuarrow_forwardJason Hilton, M.D., reported the following unadjusted trial balance as of September 30, 2025: View the trial balance. Calculate the debt ratio for Jason Hilton, M.D. Select the debt ratio formula on the first line and then calculate the ratio. (Round the percentage to the nearest whole percent.) Average total assets Average total equity Average total liabilities Net income Total assets + Total equity Total liabilities = Debt ratio % Trial Balance Account Title Cash Jason Hilton, M.D. Unadjusted Trial Balance September 30, 2025 Accounts Receivable Supplies Land Building Office Equipment Accounts Payable Utilities Payable Unearned Revenue Notes Payable Common Stock Dividends Service Revenue Salaries Expense Utilities Expense Advertising Expense Total $ Debit Balance 39,000 7,300 2,900 28,000 100,000 25,000 56,000 23,400 800 300 282,700 $ Credit 2,400 1,100 8,666 95,000 130,000 45,534 282,700 I Xarrow_forward
- Required Prepare a vertical analysis of both the balance sheets and income statements for Year 4 and Year 3. Complete this question by entering your answers in the tabs below. Analysis Bal Sheet Analysis Inc Stmt Prepare a vertical analysis of an income statements for Year 4 and Year 3. (Percentages may not add exactly due to rounding. Round your answers to 2 decimal places. (i.e., .2345 should be entered as 23.45).) ALLENDALE COMPANY Vertical Analysis of Income Statements Year 4 Year 3 Amount % Total Amount % Total Revenues Sales (net) $ 230,000 100.00 % $ 210,000 100.00 % Other revenues 8,000 5,000 Total revenues 238,000 215,000 Expenses Cost of goods sold 120,000 103,000 Selling, general, and administrative expense 55,000 50,000 Interest expense 8,000 7,200 Income tax expense 23,000 22,000 Total expenses 206,000 182,200 Net income $ 32,000 % $ 32,800 %arrow_forwardCompute the following for Stanley Limited. Round your answers to two decimal places. All answers MUST be expressed in the unit as specified in the question, if any. Show your workings. (a) Gross Profit Rate (in %) (b) Current Ratio (c) Quick Ratio B Stanley Limited Statement of Financial Position 31 December 2021 ($ in million) Stanley Limited Income Statement For the year ended 31 December 2021 ($ in million) Question B5 (continued) (d) Accounts Receivable Turnover Rate (e) Return on Equity (%) (f) Debt Ratio (in %) (g) Price-Earnings Ratioarrow_forwardH2.arrow_forward
arrow_back_ios
SEE MORE QUESTIONS
arrow_forward_ios
Recommended textbooks for you
 AccountingAccountingISBN:9781337272094Author:WARREN, Carl S., Reeve, James M., Duchac, Jonathan E.Publisher:Cengage Learning,
 Accounting Information SystemsAccountingISBN:9781337619202Author:Hall, James A.Publisher:Cengage Learning,
 Horngren's Cost Accounting: A Managerial Emphasis...AccountingISBN:9780134475585Author:Srikant M. Datar, Madhav V. RajanPublisher:PEARSON
 Intermediate AccountingAccountingISBN:9781259722660Author:J. David Spiceland, Mark W. Nelson, Wayne M ThomasPublisher:McGraw-Hill Education
 Financial and Managerial AccountingAccountingISBN:9781259726705Author:John J Wild, Ken W. Shaw, Barbara Chiappetta Fundamental Accounting PrinciplesPublisher:McGraw-Hill Education
Accounting
Accounting
ISBN:9781337272094
Author:WARREN, Carl S., Reeve, James M., Duchac, Jonathan E.
Publisher:Cengage Learning,
Accounting Information Systems
Accounting
ISBN:9781337619202
Author:Hall, James A.
Publisher:Cengage Learning,
Horngren's Cost Accounting: A Managerial Emphasis...
Accounting
ISBN:9780134475585
Author:Srikant M. Datar, Madhav V. Rajan
Publisher:PEARSON
Intermediate Accounting
Accounting
ISBN:9781259722660
Author:J. David Spiceland, Mark W. Nelson, Wayne M Thomas
Publisher:McGraw-Hill Education
Financial and Managerial Accounting
Accounting
ISBN:9781259726705
Author:John J Wild, Ken W. Shaw, Barbara Chiappetta Fundamental Accounting Principles
Publisher:McGraw-Hill Education