
Videos
Best Homes, Inc.:
Best Homes is a new home construction company with headquarters in Kansas City, Missouri. They construct only residential homes throughout the U.S. and only new homes. Having started on the East coast in 1945 they expanded to the Midwest and ultimately to the West coast and the South. They build all types of residential new homes from low-end prices to the high-end of the market.
Best Homes was a private company until 1958 when it made its first public offering. While the company started small, it has expanded to become one of the largest homebuilders in America. In 2015 Best Homes built 20,040 new homes with revenue of $6.4 billion in sales. Their sales were 4.0 percent of the national home market of over 501,000 new homes.1
COMPANY STRATEGY AND PLANNING CYCLE
Best Homes competes based on its excellent brand reputation. Their reputation is earned by building quality homes at a competitive price. The cost per square foot of their homes is comparable to competitors, but the design and interior finish of their homes is outstanding. This provides an advantage that competitors find hard to meet.
The operations and supply chain strategy is organized around having sufficient capacity to build homes on
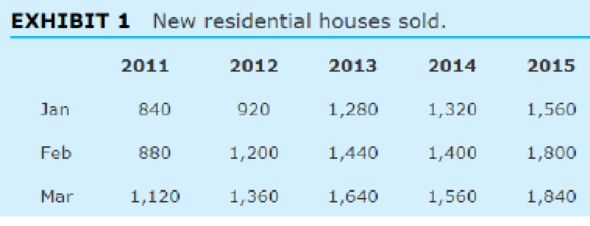
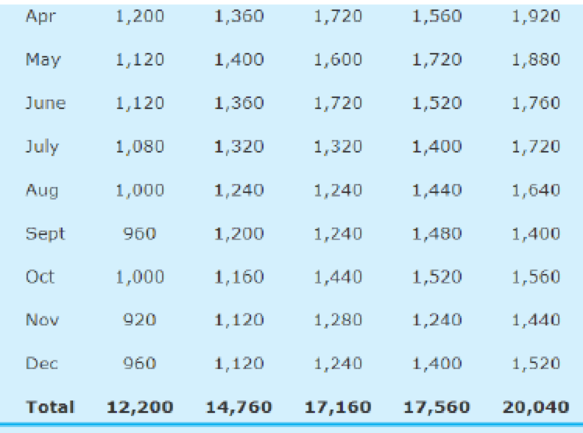
Demand or sales planning is done once a year and then updated each month. The planning cycle for annual demand includes two elements. First a forecast is made by month for the next year of new home sales. This is done using data from the past five years by month, shown in Exhibit 1. Another input to the forecasting process comes from the sales force in each region of the country. The sales force input is combined with the forecast from past sales data to come up with a final national sales forecast for the company for the next year by month.
The entire company uses the Best Homes final forecast. Financing uses it to forecast overall revenue of the company, to prepare estimates for income and balance sheet projections, along with quarterly earnings estimates. Marketing uses the monthly forecasts to plan sales projections, hiring plans, sales incentives and sales goals. Operations and Supply Chain uses the forecasts for its Sales and Operations Planning (S&OP) planning process. S&OP is done for the annual forecast and then updated monthly to make adjustments in the sales forecasts and the resulting hiring plans for new employees, contract employees, and part-time employees, along with any layoffs that might be anticipated. The S&OP process each month starts with an updated rolling forecast for each of the next 12 months. The hiring plans and home building starts are then set for the next month and planned for the next three months. The plan also includes purchasing plans for materials used to construct the houses. The monthly update can require adjustments to both capacity and inventory of new homes. All functions participate in the S&OP process including, Finance, Marketing, Sales, Operations, and HR.
FORECASTING DEMAND
Demand forecasting has been difficult due to the seasonal and trend variations. This is why the forecast and associated planning activities are updated monthly and projected for the next twelve months. Insufficient capacity or inventory can have a dramatic effect on sales and profits. Either too much capacity or too little is a problem along with too little or too many homes in inventory.
The first part of the planning process is to forecast demand for new homes on a monthly basis. To accomplish this data in Exhibit 1 is provided. It shows the number of new single-family houses built in each month by Best Homes. The task is to forecast this data forward for the year of 2016 by month.
It is not enough to only forecast the average monthly demand going forward. Actual demand can be significantly higher or lower than the average. As a result, the standard deviation of demand, or mean absolute deviation, must also be forecasted. The monthly production level for new homes is then set at the average demand plus a safety stock of new homes for when the demand exceeds the average. Since there is a three-month lead-time for building new homes, any inventory and production levels must anticipate the three-month lead-time. This illustrates how critical forecasting is for both purposes of planning production levels and inventory.
Discussion Questions
- 1. What forecasting methods should the company consider? Please justify.
- 2. Use the classical decomposition method to forecast average demand for 2016 by month. What is your forecast of monthly average demand for 2016?
- 3. Best Homes is also collecting sales projections from each of its regions for 2016. What role should these additional sales projections play, along with the forecast from question 2, in determining the final national forecast?
This case was prepared by Roger G. Schroeder for class discussion. Copyright © by Roger G. Schroeder, 2016. All rights are reserved. Reprinted with permission.
Want to see the full answer?
Check out a sample textbook solution
Chapter CS Solutions
OPERATIONS MANAGEMENT IN THE SUPPLY CHAIN: DECISIONS & CASES (Mcgraw-hill Series Operations and Decision Sciences)


- Scenario 3 Ben Gibson, the purchasing manager at Coastal Products, was reviewing purchasing expenditures for packaging materials with Jeff Joyner. Ben was particularly disturbed about the amount spent on corrugated boxes purchased from Southeastern Corrugated. Ben said, I dont like the salesman from that company. He comes around here acting like he owns the place. He loves to tell us about his fancy car, house, and vacations. It seems to me he must be making too much money off of us! Jeff responded that he heard Southeastern Corrugated was going to ask for a price increase to cover the rising costs of raw material paper stock. Jeff further stated that Southeastern would probably ask for more than what was justified simply from rising paper stock costs. After the meeting, Ben decided he had heard enough. After all, he prided himself on being a results-oriented manager. There was no way he was going to allow that salesman to keep taking advantage of Coastal Products. Ben called Jeff and told him it was time to rebid the corrugated contract before Southeastern came in with a price increase request. Who did Jeff know that might be interested in the business? Jeff replied he had several companies in mind to include in the bidding process. These companies would surely come in at a lower price, partly because they used lower-grade boxes that would probably work well enough in Coastal Products process. Jeff also explained that these suppliers were not serious contenders for the business. Their purpose was to create competition with the bids. Ben told Jeff to make sure that Southeastern was well aware that these new suppliers were bidding on the contract. He also said to make sure the suppliers knew that price was going to be the determining factor in this quote, because he considered corrugated boxes to be a standard industry item. Is Ben Gibson acting legally? Is he acting ethically? Why or why not?arrow_forwardScenario 3 Ben Gibson, the purchasing manager at Coastal Products, was reviewing purchasing expenditures for packaging materials with Jeff Joyner. Ben was particularly disturbed about the amount spent on corrugated boxes purchased from Southeastern Corrugated. Ben said, I dont like the salesman from that company. He comes around here acting like he owns the place. He loves to tell us about his fancy car, house, and vacations. It seems to me he must be making too much money off of us! Jeff responded that he heard Southeastern Corrugated was going to ask for a price increase to cover the rising costs of raw material paper stock. Jeff further stated that Southeastern would probably ask for more than what was justified simply from rising paper stock costs. After the meeting, Ben decided he had heard enough. After all, he prided himself on being a results-oriented manager. There was no way he was going to allow that salesman to keep taking advantage of Coastal Products. Ben called Jeff and told him it was time to rebid the corrugated contract before Southeastern came in with a price increase request. Who did Jeff know that might be interested in the business? Jeff replied he had several companies in mind to include in the bidding process. These companies would surely come in at a lower price, partly because they used lower-grade boxes that would probably work well enough in Coastal Products process. Jeff also explained that these suppliers were not serious contenders for the business. Their purpose was to create competition with the bids. Ben told Jeff to make sure that Southeastern was well aware that these new suppliers were bidding on the contract. He also said to make sure the suppliers knew that price was going to be the determining factor in this quote, because he considered corrugated boxes to be a standard industry item. As the Marketing Manager for Southeastern Corrugated, what would you do upon receiving the request for quotation from Coastal Products?arrow_forwardScenario 4 Sharon Gillespie, a new buyer at Visionex, Inc., was reviewing quotations for a tooling contract submitted by four suppliers. She was evaluating the quotes based on price, target quality levels, and delivery lead time promises. As she was working, her manager, Dave Cox, entered her office. He asked how everything was progressing and if she needed any help. She mentioned she was reviewing quotations from suppliers for a tooling contract. Dave asked who the interested suppliers were and if she had made a decision. Sharon indicated that one supplier, Apex, appeared to fit exactly the requirements Visionex had specified in the proposal. Dave told her to keep up the good work. Later that day Dave again visited Sharons office. He stated that he had done some research on the suppliers and felt that another supplier, Micron, appeared to have the best track record with Visionex. He pointed out that Sharons first choice was a new supplier to Visionex and there was some risk involved with that choice. Dave indicated that it would please him greatly if she selected Micron for the contract. The next day Sharon was having lunch with another buyer, Mark Smith. She mentioned the conversation with Dave and said she honestly felt that Apex was the best choice. When Mark asked Sharon who Dave preferred, she answered, Micron. At that point Mark rolled his eyes and shook his head. Sharon asked what the body language was all about. Mark replied, Look, I know youre new but you should know this. I heard last week that Daves brother-in-law is a new part owner of Micron. I was wondering how soon it would be before he started steering business to that company. He is not the straightest character. Sharon was shocked. After a few moments, she announced that her original choice was still the best selection. At that point Mark reminded Sharon that she was replacing a terminated buyer who did not go along with one of Daves previous preferred suppliers. Ethical decisions that affect a buyers ethical perspective usually involve the organizational environment, cultural environment, personal environment, and industry environment. Analyze this scenario using these four variables.arrow_forward
- Scenario 4 Sharon Gillespie, a new buyer at Visionex, Inc., was reviewing quotations for a tooling contract submitted by four suppliers. She was evaluating the quotes based on price, target quality levels, and delivery lead time promises. As she was working, her manager, Dave Cox, entered her office. He asked how everything was progressing and if she needed any help. She mentioned she was reviewing quotations from suppliers for a tooling contract. Dave asked who the interested suppliers were and if she had made a decision. Sharon indicated that one supplier, Apex, appeared to fit exactly the requirements Visionex had specified in the proposal. Dave told her to keep up the good work. Later that day Dave again visited Sharons office. He stated that he had done some research on the suppliers and felt that another supplier, Micron, appeared to have the best track record with Visionex. He pointed out that Sharons first choice was a new supplier to Visionex and there was some risk involved with that choice. Dave indicated that it would please him greatly if she selected Micron for the contract. The next day Sharon was having lunch with another buyer, Mark Smith. She mentioned the conversation with Dave and said she honestly felt that Apex was the best choice. When Mark asked Sharon who Dave preferred, she answered, Micron. At that point Mark rolled his eyes and shook his head. Sharon asked what the body language was all about. Mark replied, Look, I know youre new but you should know this. I heard last week that Daves brother-in-law is a new part owner of Micron. I was wondering how soon it would be before he started steering business to that company. He is not the straightest character. Sharon was shocked. After a few moments, she announced that her original choice was still the best selection. At that point Mark reminded Sharon that she was replacing a terminated buyer who did not go along with one of Daves previous preferred suppliers. What should Sharon do in this situation?arrow_forwardScenario 4 Sharon Gillespie, a new buyer at Visionex, Inc., was reviewing quotations for a tooling contract submitted by four suppliers. She was evaluating the quotes based on price, target quality levels, and delivery lead time promises. As she was working, her manager, Dave Cox, entered her office. He asked how everything was progressing and if she needed any help. She mentioned she was reviewing quotations from suppliers for a tooling contract. Dave asked who the interested suppliers were and if she had made a decision. Sharon indicated that one supplier, Apex, appeared to fit exactly the requirements Visionex had specified in the proposal. Dave told her to keep up the good work. Later that day Dave again visited Sharons office. He stated that he had done some research on the suppliers and felt that another supplier, Micron, appeared to have the best track record with Visionex. He pointed out that Sharons first choice was a new supplier to Visionex and there was some risk involved with that choice. Dave indicated that it would please him greatly if she selected Micron for the contract. The next day Sharon was having lunch with another buyer, Mark Smith. She mentioned the conversation with Dave and said she honestly felt that Apex was the best choice. When Mark asked Sharon who Dave preferred, she answered, Micron. At that point Mark rolled his eyes and shook his head. Sharon asked what the body language was all about. Mark replied, Look, I know youre new but you should know this. I heard last week that Daves brother-in-law is a new part owner of Micron. I was wondering how soon it would be before he started steering business to that company. He is not the straightest character. Sharon was shocked. After a few moments, she announced that her original choice was still the best selection. At that point Mark reminded Sharon that she was replacing a terminated buyer who did not go along with one of Daves previous preferred suppliers. What does the Institute of Supply Management code of ethics say about financial conflicts of interest?arrow_forwardGarfield Industries is expanding its operations throughout the Southeast United States. Garfield anticipates that the expansion will increase sales by $1,000,000 and increase operating costs (excluding depreciation and amortization) by $700,000. Depreciation and amortization expenses will rise by $50,000, interest expense will increase by $150,000, and the company’s tax rate will remain at 40 percent. If the company’s forecast is correct, how much will net income increase or decrease, as a result of the expansion?arrow_forward
- DLSU 40,000 (COB 5,000; CCS 15%; CLA 20%; COL 5% and others) Average price per computer device Php25,000Average price per Apple device Php30,000 In DLSU, students from COB, COL, and CLA purchased at least one (1) computer device in December 2020. What is the market penetration of computer device in the individual colleges? Given that students replace their computer devices once every 2 years on average, what is the projected market size (units/revenues) for computer devices for these colleges until the end of 2025? What is the concentration of sales/revenue of computer devices among the colleges (CDI)?arrow_forwardThe following table gives the annual revenue for two different companies (in billions of dollars) for a 10-year period Construct a boxplot for Company A. Year 2007 2008 2009 Company A 94 100 99 99 Company B 46 63 60 69 2010 2011 2012 2013 2014 2015 2016 106 102 101 92 89 84 78 76 82 93 89 74 Min= Q₁ = (Type integers or decimals.) *** What is the five-number summary of the annual revenues for Company A? Q₂ = Q3 = Max =arrow_forwardMr. Zulhakim being assigned by his manager to develop their production planning for Year 2022. Table 3 shows the information that he able to obtain from the sales & marketing department. After doing the planning, Mr Zulhakim need to present it to his manager. Factory developed a demand forecast based on Table 3 with supplier charges about RM300.00 per unit. The demand forecast is stated as week but, in this planning, it is being considered as an annual quantity for the operation. Ordering cost is RM150.00. Annual holding cost is 10 percent of a purchased price. (b) Develop the ATP of this plan. Initial inventory on hand is 50 units obtained from Year 2021. Lot size for MPS can be obtained by using EOQ model. Table 3: Demand and Customer confirmed order quantity 8 9 10 2 3 10 40 10 00 30 20 40 20 30 Period (Week) 1 4 5 6 7 Forecast (units) Customer orders (booked) (unit) 20 8. 2arrow_forward
- Give some examples of industries where demand forecasting is influenced by demand for other goods.arrow_forward7-3. Nowjuice, Inc., produces Shakewell fruit juice. A planner has developed an aggregate forecast for demand (in cases) for the next eight months. month Apr forecast 4500 May 4400 Jun 6200 Jul 6400 Aug 5800 Sep 6600 Oct 7200 Nov 6900 Use the following information to develop aggregate plans. Regular production cost: $10.00 per case Regular production capacity: 5,000 cases Overtime production cost: $16 per case Subcontracting cost: $20 per case Holding cost: $1 per case per month Beginning inventory: 0 Develop an aggregate plan using each of the following guidelines and compute the total cost for each plan. Which plan has the lowest total cost? (a) Use level production of 5,000 case per month. Supplement using overtime as needed (b) Use a combination of overtime (500 cases per month for the first five months), inventory, and subcontracting (500 cases per month from September to November, if necessary) to handle variations in demand. Note that suitable amounts of overtime for the last…arrow_forwardTRADEKINGS is a soft drink manufacturer in Zambia. Although it has a commanding share of the soft drink market in Zambia, it is facing increasing competition from a soft drink known as Atia from Kenya and the Coca-Cola line of soft drinks. Required: Use a Product Portfolio (SWOT) Analysis to: Identify the opportunity OR threat to the Identify the company’s strength OR weakness of the company Recommend an appropriate strategyarrow_forward
 Purchasing and Supply Chain ManagementOperations ManagementISBN:9781285869681Author:Robert M. Monczka, Robert B. Handfield, Larry C. Giunipero, James L. PattersonPublisher:Cengage Learning
 Practical Management ScienceOperations ManagementISBN:9781337406659Author:WINSTON, Wayne L.Publisher:Cengage,
 MarketingMarketingISBN:9780357033791Author:Pride, William MPublisher:South Western Educational Publishing