
Elementary Statistics: Picturing the World (7th Edition)
7th Edition
ISBN: 9780134683416
Author: Ron Larson, Betsy Farber
Publisher: PEARSON
expand_more
expand_more
format_list_bulleted
Videos
Textbook Question
Chapter 8.4, Problem 22E
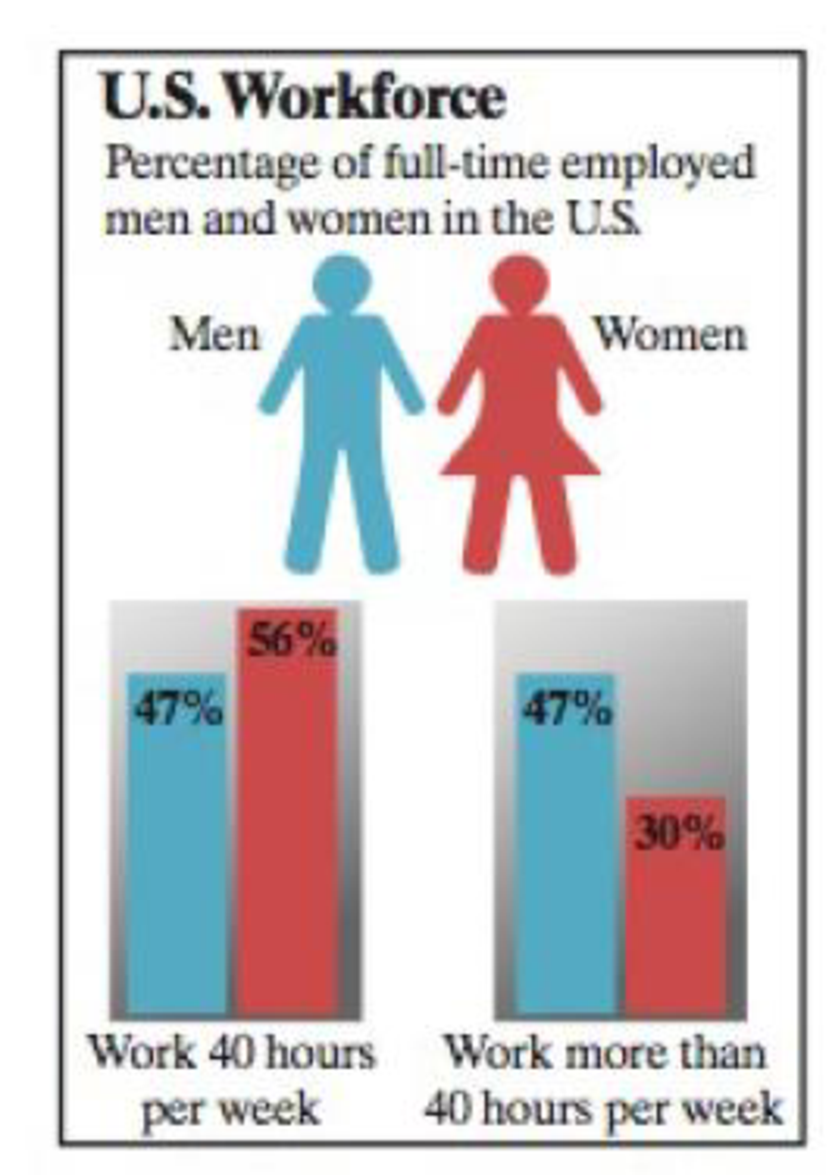
U.S. Workforce In Exercises 19–22, use the figure shown at the left, which gives the percentages of full-time employed men and women in the United States who work 40 hours per week and who work more than 40 hours per week. Assume the survey included random samples of 300 men and 250 women. (Adapted from Gallup)
22. Working More Than 40 Hours Per Week: Men and Women At α = 0.10, can you support the claim that the proportion of the U.S. workforce that works more than 40 hours per week is less for women than for men?
Expert Solution & Answer
Want to see the full answer?
Check out a sample textbook solution
Students have asked these similar questions
How is my work? Should anything be changed?
A researcher wanted to examine the effect of a new math study skills program on second graders. Fifteen students took the new study skills program for six weeks and then took a standardized math exam, which is known to have a population mean score of µ = 80. The scores on the exam for the 15 students (who took the study skills program) are reported below.
Scores on the standardized math exam for the 15 students:78, 85, 83, 75, 81, 85, 84, 82, 78, 83, 78, 90, 85, 83, 81
Test to see whether the students who took the new study skills program have significantly higher test scores than the national average. Perform the appropriate test in SPSS using α = .05
a. State the null and alternative hypotheses below.
Null hypothesis:
H0: μ = 80.
Alternative hypothesis:
H1: μ > 80
b. What type of test should be run on the data (be specific with the exact name of the test)? For example, don’t just state “t test,” but the specific t-test used.
One sample…
A random sample of 50 CSCC students are surveyed to determine what percent of our students are first-generation college students. The results showed that 16 of the students identify as first-generation college students. show your work
What is the sample proportion of first-generation college students at CSCC?
Is this an example of a parameter or a statistic? Explain.
What type of data would you use for collecting data on lap swim time?
Chapter 8 Solutions
Elementary Statistics: Picturing the World (7th Edition)
Ch. 8.1 - Classify each pair of samples as independent or...Ch. 8.1 - A survey indicates that the mean annual wages for...Ch. 8.1 - A travel agency claims that the average daily cost...Ch. 8.1 - What is the difference between two samples that...Ch. 8.1 - Explain how to perform a two-sample z-test for the...Ch. 8.1 - Describe another way you can perform a hypothesis...Ch. 8.1 - What conditions are necessary in order to use the...Ch. 8.1 - Prob. 5ECh. 8.1 - Prob. 6ECh. 8.1 - Independent and Dependent Samples In Exercises 58,...
Ch. 8.1 - Prob. 8ECh. 8.1 - In Exercises 9 and 10, use the TI-H4 Plus display...Ch. 8.1 - Prob. 10ECh. 8.1 - Prob. 11ECh. 8.1 - In Exercises 1114, test the claim about the...Ch. 8.1 - In Exercises 1114, test the claim about the...Ch. 8.1 - Prob. 14ECh. 8.1 - Testing the Difference Between Two Means In...Ch. 8.1 - Testing the Difference Between Two Means In...Ch. 8.1 - Prob. 17ECh. 8.1 - Prob. 18ECh. 8.1 - Prob. 19ECh. 8.1 - Testing the Difference Between Two Means In...Ch. 8.1 - Testing the Difference Between Two Means In...Ch. 8.1 - Prob. 22ECh. 8.1 - Prob. 23ECh. 8.1 - Prob. 24ECh. 8.1 - Prob. 25ECh. 8.1 - Getting at the Concept Explain why the null...Ch. 8.1 - Testing a Difference Other Than Zero Sometimes a...Ch. 8.1 - Testing a Difference Other Than Zero Sometimes a...Ch. 8.1 - Prob. 29ECh. 8.1 - Architect Salaries Construct a 99% confidence...Ch. 8.2 - The annual earnings of 25 people with a high...Ch. 8.2 - A manufacturer claims that the mean driving cost...Ch. 8.2 - What conditions are necessary in order to use the...Ch. 8.2 - Explain how to perform a two-sample t-test for the...Ch. 8.2 - Prob. 3ECh. 8.2 - Prob. 4ECh. 8.2 - Prob. 5ECh. 8.2 - Prob. 6ECh. 8.2 - In Exercises 38, use Table 5 in Appendix B to find...Ch. 8.2 - Prob. 8ECh. 8.2 - In Exercises 912, test the claim about the...Ch. 8.2 - Prob. 10ECh. 8.2 - Prob. 11ECh. 8.2 - In Exercises 912, test the claim about the...Ch. 8.2 - Testing the Difference Between Two Means in...Ch. 8.2 - Testing the Difference Between Two Means in...Ch. 8.2 - Testing the Difference Between Two Means in...Ch. 8.2 - Testing the Difference Between Two Means in...Ch. 8.2 - Prob. 17ECh. 8.2 - Prob. 18ECh. 8.2 - Prob. 19ECh. 8.2 - Testing the Difference Between Two Means in...Ch. 8.2 - Testing the Difference Between Two Means in...Ch. 8.2 - Testing the Difference Between Two Means in...Ch. 8.2 - Constructing Confidence Intervals for 1 2 When...Ch. 8.2 - Constructing Confidence Intervals for 1 2 When...Ch. 8.2 - Constructing Confidence Intervals for 1 2 When...Ch. 8.2 - Prob. 26ECh. 8.2 - How Protein Affects Weight Gain in Overeaters In a...Ch. 8.2 - Prob. 2CSCh. 8.2 - How Protein Affects Weight Gain in Overeaters In a...Ch. 8.2 - Prob. 4CSCh. 8.2 - Prob. 5CSCh. 8.3 - A shoe manufacturer claims that athletes can...Ch. 8.3 - Prob. 2TYCh. 8.3 - Prob. 1ECh. 8.3 - Prob. 2ECh. 8.3 - Prob. 3ECh. 8.3 - Prob. 4ECh. 8.3 - Prob. 5ECh. 8.3 - Prob. 6ECh. 8.3 - Prob. 7ECh. 8.3 - Prob. 8ECh. 8.3 - Prob. 9ECh. 8.3 - Testing the Difference Between Two Means In...Ch. 8.3 - Prob. 11ECh. 8.3 - Prob. 12ECh. 8.3 - Prob. 13ECh. 8.3 - Testing the Difference Between Two Means In...Ch. 8.3 - Prob. 15ECh. 8.3 - Prob. 16ECh. 8.3 - Testing the Difference Between Two Means In...Ch. 8.3 - Testing the Difference Between Two Means In...Ch. 8.3 - Testing the Difference Between Two Means In...Ch. 8.3 - Prob. 20ECh. 8.3 - Prob. 21ECh. 8.3 - Prob. 22ECh. 8.3 - Prob. 23ECh. 8.3 - Prob. 24ECh. 8.4 - Consider the results of the study discussed on...Ch. 8.4 - Prob. 2TYCh. 8.4 - What conditions are necessary in order to use the...Ch. 8.4 - Explain how to perform a two-sample z-test for the...Ch. 8.4 - In Exercises 36, determine whether a normal...Ch. 8.4 - Prob. 4ECh. 8.4 - Prob. 5ECh. 8.4 - In Exercises 36, determine whether a normal...Ch. 8.4 - Prob. 7ECh. 8.4 - Testing the Difference Between Two Proportions In...Ch. 8.4 - Prob. 9ECh. 8.4 - Prob. 10ECh. 8.4 - Prob. 11ECh. 8.4 - Testing the Difference Between Two Proportions In...Ch. 8.4 - Prob. 13ECh. 8.4 - Prob. 14ECh. 8.4 - Intermarriages In Exercises 1318, use the figure,...Ch. 8.4 - Prob. 16ECh. 8.4 - Prob. 17ECh. 8.4 - Intermarriages In Exercises 1318, use the figure,...Ch. 8.4 - Prob. 19ECh. 8.4 - Prob. 20ECh. 8.4 - Prob. 21ECh. 8.4 - U.S. Workforce In Exercises 1922, use the figure...Ch. 8.4 - Prob. 23ECh. 8.4 - Prob. 24ECh. 8.4 - Prob. 25ECh. 8.4 - Prob. 26ECh. 8 - Uses Hypothesis Testing with Two Samples...Ch. 8 - Medical research often involves blind and...Ch. 8 - Prob. 8.1.1RECh. 8 - Prob. 8.1.2RECh. 8 - Sample 1: The fuel efficiencies of 20 sports...Ch. 8 - Prob. 8.1.4RECh. 8 - Prob. 8.1.5RECh. 8 - In Exercises 58, test the claim about the...Ch. 8 - Prob. 8.1.7RECh. 8 - In Exercises 58, test the claim about the...Ch. 8 - In Exercises 9 and 10, (a) identify the claim and...Ch. 8 - Prob. 8.1.10RECh. 8 - Prob. 8.2.11RECh. 8 - Prob. 8.2.12RECh. 8 - Prob. 8.2.13RECh. 8 - Prob. 8.2.14RECh. 8 - Prob. 8.2.15RECh. 8 - Prob. 8.2.16RECh. 8 - Prob. 8.2.17RECh. 8 - Prob. 8.2.18RECh. 8 - Prob. 8.3.19RECh. 8 - In Exercises 1922, test the claim about the mean...Ch. 8 - Prob. 8.3.21RECh. 8 - Prob. 8.3.22RECh. 8 - Prob. 8.3.23RECh. 8 - In Exercises 23 and 24, (a) identify the claim and...Ch. 8 - Prob. 8.4.25RECh. 8 - Prob. 8.4.26RECh. 8 - Prob. 8.4.27RECh. 8 - Prob. 8.4.28RECh. 8 - Prob. 8.4.29RECh. 8 - Prob. 8.4.30RECh. 8 - Prob. 1CQCh. 8 - Prob. 2CQCh. 8 - Prob. 3CQCh. 8 - Prob. 4CQCh. 8 - Take this test as you would take a test in class....Ch. 8 - Prob. 2CTCh. 8 - A physical therapist suggests that soft tissue...Ch. 8 - Take this test as you would take a test in class....Ch. 8 - The U.S. Department of Health Human Services...Ch. 8 - Prob. 2RSRDCh. 8 - Prob. 3RSRDCh. 8 - Prob. 4RSRDCh. 8 - Prob. 1TCh. 8 - Prob. 2TCh. 8 - Prob. 3TCh. 8 - Prob. 4TCh. 8 - Prob. 5TCh. 8 - Prob. 1CRCh. 8 - Prob. 2CRCh. 8 - Prob. 3CRCh. 8 - Prob. 4CRCh. 8 - In Exercises 36, construct the indicated...Ch. 8 - In Exercises 36, construct the indicated...Ch. 8 - In Exercises 710, the statement represents a...Ch. 8 - In Exercises 710, the statement represents a...Ch. 8 - In Exercises 710, the statement represents a...Ch. 8 - In Exercises 710, the statement represents a...Ch. 8 - Prob. 11CRCh. 8 - Prob. 12CRCh. 8 - Prob. 13CRCh. 8 - Prob. 14CRCh. 8 - Prob. 15CRCh. 8 - Prob. 16CRCh. 8 - A researcher claims that 5% of people who wear...
Knowledge Booster


Learn more about
Need a deep-dive on the concept behind this application? Look no further. Learn more about this topic, statistics and related others by exploring similar questions and additional content below.Similar questions
- Compute the standard scores for the values 0.49, 0.18,and 0.90. Interpret these scores. What conclusions can you make about these data values based on their standard scoresarrow_forwardWhat steps should you follow in collecting the data of your study?arrow_forwardwhat is scatter diagram?In the manufacturing process of a chemical product, the relationship between the raw material purity and the manufacturing time in the extraction ratio is examined and the data is given in the table below. Plot a scatter diagram onto graph paper.arrow_forward
- Which statistical test do you use when you want to compare the change in average of group to the average of another group before and after a treatment?arrow_forwardindicator for gender (=1 if male, =0 if female). Your data set has 200 observations. donation = 1.57 + 0.12age + 0.08age? – 0.43 gender + 0.07(gender * age), R? = 0.33 (0.15)* (0.67) (0.11) (0.01) (0.06) donation = 1.59 (0.68) 0.46 gender, R² = 0.30 (0.17) 1. Assuming homoscedastic errors, test the hypothesis that age affects charitable donations at the 5% level. 2. Interpret the coefficient on gender interacted with age. 3. How would you test that the difference in giving between men and women is independent of age? If you can run the test, run it. If you cannot, explain what you need.arrow_forwardPlease help me figure out the T-Statisticarrow_forward
- define the terms population parameter, and sample statistics as they apply to statistical studies.arrow_forwardQUESTION 8 h) What is the R Square of this model? What does it mean? Use the information in ANOVA table to calculate R square. For the toolbar, press ALT+F10 (PC) or ALT+FN+F10 (Mac).arrow_forwardSampling is the main technique for the size of data from the population size to a manageable size.arrow_forward
- Give an statistical principle example for a surgeonarrow_forwardAnkle Brachial Index. The ankle brachial index (ABI) compares the blood pressure of a patient’s arm to the blood pressure of the patient’s leg. The ABI can be an indicator of different diseases, including arterial diseases. A healthy (or normal) ABI is 0.9 or greater. In a study by M. McDermott et al. titled “Sex Differences in Peripheral Arterial Disease: Leg Symptoms and Physical Functioning” (Journal of the American Geriatrics Society, Vol. 51, No. 2, pp. 222–228), the researchers obtained the ABI of 187 women with peripheral arterial disease. The results were a mean ABI of 0.64 with a standard deviation of 0.15. At the 1% significance level, do the data provide sufficient evidence to conclude that, on average, women with peripheral arterial disease have an unhealthy ABI?arrow_forwardA survey is carried out at a university to estimate the percentage of undergraduates living at home during the current term. What is the population? the parameter?arrow_forward
arrow_back_ios
SEE MORE QUESTIONS
arrow_forward_ios
Recommended textbooks for you
 Glencoe Algebra 1, Student Edition, 9780079039897...AlgebraISBN:9780079039897Author:CarterPublisher:McGraw Hill
 Big Ideas Math A Bridge To Success Algebra 1: Stu...AlgebraISBN:9781680331141Author:HOUGHTON MIFFLIN HARCOURTPublisher:Houghton Mifflin Harcourt
Glencoe Algebra 1, Student Edition, 9780079039897...
Algebra
ISBN:9780079039897
Author:Carter
Publisher:McGraw Hill
Big Ideas Math A Bridge To Success Algebra 1: Stu...
Algebra
ISBN:9781680331141
Author:HOUGHTON MIFFLIN HARCOURT
Publisher:Houghton Mifflin Harcourt
Hypothesis Testing using Confidence Interval Approach; Author: BUM2413 Applied Statistics UMP;https://www.youtube.com/watch?v=Hq1l3e9pLyY;License: Standard YouTube License, CC-BY
Hypothesis Testing - Difference of Two Means - Student's -Distribution & Normal Distribution; Author: The Organic Chemistry Tutor;https://www.youtube.com/watch?v=UcZwyzwWU7o;License: Standard Youtube License