
Videos
Testing the Difference Between Two Means In Exercises 9–20, (a) identify the claim and state H0 and Ha, (b) find the critical value(s) and identify the rejection region(s), (c) calculate
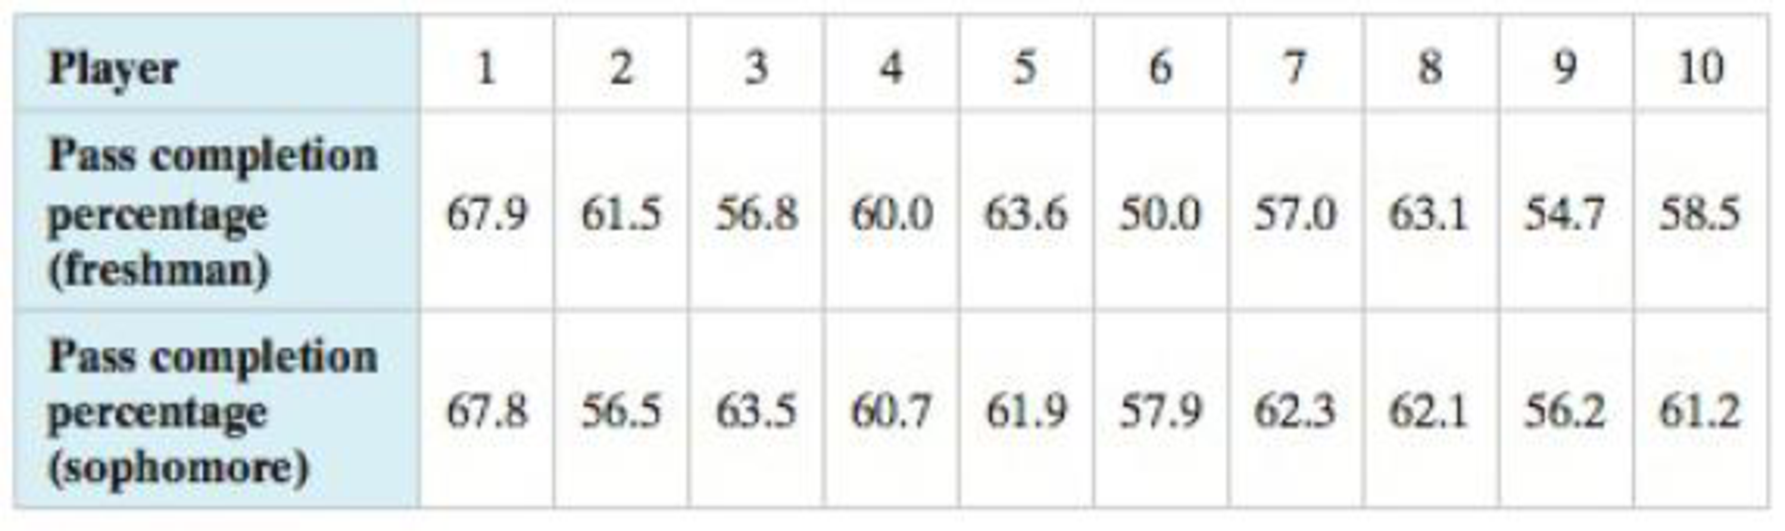
18. Pass Completion Percentages The pass completion percentages of 10 college football quarterbacks for their freshman and sophomore seasons are shown in the table below. At α = 0.10, is there enough evidence to support the claim that the pass completion percentages have changed? (Source: Sports Reference, LLC)
Want to see the full answer?
Check out a sample textbook solution
Chapter 8 Solutions
Elementary Statistics: Picturing the World (7th Edition)


- Perform the hypothesis test at 5% significance level using the p-value approach x=33, s=10, n=24, H0: u=26, Ha: u>26 What is the test statistic, p value, and conclusion for the hypothesisarrow_forward(a) Identify the claim and state H0 and Ha. (b) Find the critical value(s) and identify the rejection region(s). (c) Find the standardized test statistic. (d) Decide whether to reject or fail to reject the null hypothesis. (e) Interpret the decision in the context of the original claim.arrow_forwardTest the claim that the mean GPA of Orange Coast students is larger than the mean GPA of Coastline students at the 0.01 significance level. The null and alternative hypothesis would be: Ho:μο = μc Ho:μο με H1:po pc Hy:μο < με Reject the null hypothesis O Fail to reject the null hypothesis (to 2 decimals) (to 2 decimals)arrow_forward
- (a) Identify the claim and state H0 and Ha. (b) Find the critical value(s) and identify the rejection region(s). (c) Find the standardized test statistic, z. (d) Decide whether to reject or fail to reject the null hypothesis. (e) Interpret the decision in the context of the original claimarrow_forward(b) Find the critical value(s) and identify the rejection region(s). (c) Find the standardized test statistic t. (d) Decide whether to reject or fail to reject the null hypothesis. (e) Interpret the decision in the context of the original claim.arrow_forward(a) Identify the claim and state H0 and Ha.What is the claim? Let Region A be sample 1 and let Region B be sample 2. Identify H0 and Ha. (b) Find the critical value(s) and identify the rejection region. What is the rejection region? (c) Find the standardized test statistic z. (d) Decide whether to reject or fail to reject the null hypothesis and interpret the decision in the context of the original claim.arrow_forward
- Test the claim that the mean GPA of night students is significantly different than the mean GPA of day students at the 0.05 significance level. The null and alternative hypothesis would be: Ho:PN 2 PD Ho:PN = PD Ho: PN PD H1:UN > HD H1:uN Next Question M hparrow_forwardSelect all the studies where the explanatory variable is measured at the same time as the outcome variable. Clinical Trial Case-Control Cross-Sectional Cohort A survey where a large portion of those under the age of 25 in the sample did not answer the questions about drug use is an example of what type of bias? Selection Measurement Respone Non-Response When the population of interest is everyone in a high school, but only people who attend the sporting events are recruited into the sample, this is an example of what kind of bias? Selection Measurement Respone Non-Responsearrow_forwardWork Conduct the hypothesis test and provide the test statistic and the critical value, and state the conclusion. A person drilled a hole in a die and filled it with a lead weight, then proceeded to roll it 200 times. Here are the observed frequencies for the outcomes of 1, 2, 3, 4, 5, and 6, respectively: 27, 29, 50, 41, 29, 24. Use a 0.10 significance level to test the claim that the outcomes are not equally likely. Does it appear that the loaded die behaves differently than a fair die? Click here to view the chi-square distribution table. The test statistic is. (Round to three decimal places as needed.) The critical value is (Round to three decimal places as needed.) State the conclusion. Ho- There sufficient evidence to support the claim that the outcomes are not equally likely. The outcomes to be equally likely, so the loaded die to behave differently from a fair die.arrow_forward
- Illustrate the null hypothesis for a correlated t test?arrow_forwardFind the test statistic for this hypothesis test. Z= Determine the P Value P-Value=arrow_forwardAnalysis of whether two categorical variables, X = course subject and Y = grade earned by a student was conducted. Researchers selected n = 800 students for their study using m = 4 distinct courses and k = 6 grades, from A to F and W. They evaluated a x2 test statistic for testing independence between X and Y equal to TS = 29.64 At the significance level a = 0.01, do researchers have sufficient evidence that X and Y are dependent? 1. Show critical value (or values) needed for this procedure 2. Formulate the rejection rule 3. State your decision: whether the independence hypothesis should be rejected at the significance level a = 0.01 Solutionarrow_forward
 Calculus For The Life SciencesCalculusISBN:9780321964038Author:GREENWELL, Raymond N., RITCHEY, Nathan P., Lial, Margaret L.Publisher:Pearson Addison Wesley,