
Videos
Testing the Difference Between Two Means In Exercises 9–20, (a) identify the claim and state H0 and Ha, (b) find the critical value(s) and identify the rejection region(s), (c) calculate
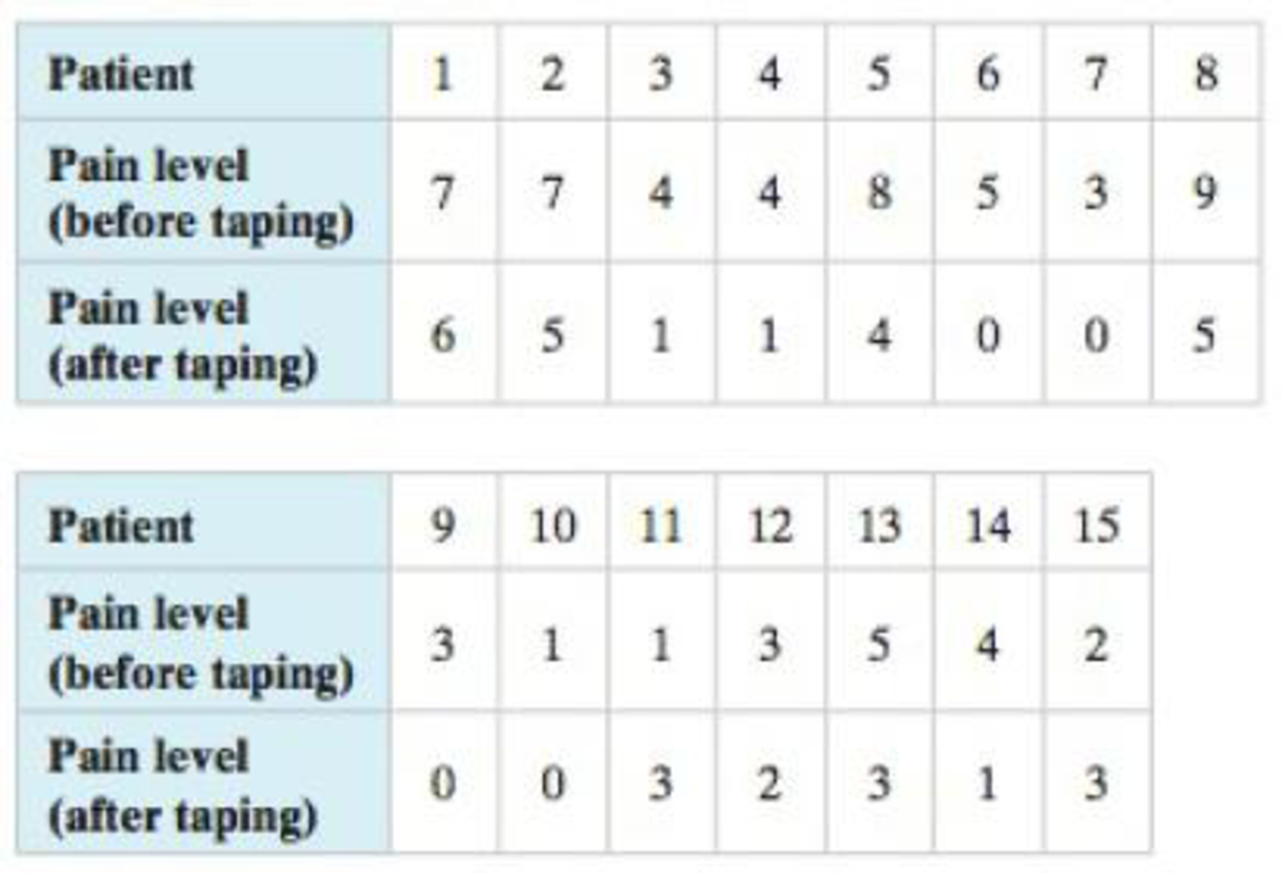
14. Therapeutic Taping A physical therapist claims that the use of a specific type of therapeutic tape reduces pain in patients with chronic tennis elbow. The table shows the pain levels on a scale of 0 to 10, where 0 is no pain and 10 is the worst pain possible, for 15 patients with chronic tennis elbow when holding a 1 kilogram weight. At α = 0.05, is there enough evidence to support the therapist’s claim? (Adapted from BioMed Central, Ltd.)
Want to see the full answer?
Check out a sample textbook solution
Chapter 8 Solutions
Elementary Statistics: Picturing the World (7th Edition)


- Perform the hypothesis test at 5% significance level using the p-value approach x=33, s=10, n=24, H0: u=26, Ha: u>26 What is the test statistic, p value, and conclusion for the hypothesisarrow_forward(a) Identify the claim and state H0 and Ha. (b) Find the critical value(s) and identify the rejection region(s). (c) Find the standardized test statistic. (d) Decide whether to reject or fail to reject the null hypothesis. (e) Interpret the decision in the context of the original claim.arrow_forward(b) Find the critical value(s) and identify the rejection region(s). (c) Find the standardized test statistic t. (d) Decide whether to reject or fail to reject the null hypothesis. (e) Interpret the decision in the context of the original claim.arrow_forward
- Test the claim that the mean GPA of Orange Coast students is larger than the mean GPA of Coastline students at the 0.01 significance level. The null and alternative hypothesis would be: Ho:μο = μc Ho:μο με H1:po pc Hy:μο < με Reject the null hypothesis O Fail to reject the null hypothesis (to 2 decimals) (to 2 decimals)arrow_forward(a) Identify the claim and state H0 and Ha. (b) Find the critical value(s) and identify the rejection region(s). (c) Find the standardized test statistic, z. (d) Decide whether to reject or fail to reject the null hypothesis. (e) Interpret the decision in the context of the original claimarrow_forwardTest the claim that the mean GPA of night students is significantly different than the mean GPA of day students at the 0.05 significance level. The null and alternative hypothesis would be: Ho:PN 2 PD Ho:PN = PD Ho: PN PD H1:UN > HD H1:uN Next Question M hparrow_forward
- Test the claim that the proportion of people who own cats is larger than 20% at the 0.005 significance level. The null and alternative hypothesis would be: H2:p = 0.2 Họ:p 2 0.2 H9:p 0.2 H9:p = 0.2 Hg: u 0.2 H1: u 0.2 The test is: left-tailed two-tailed right-tailed Based on a sample of 300 people, 24% owned cats The test statistic is: (to 2 decimals) The p-value is: (to 2 decimals) Based on this we: O Reject the null hypothesis O Fail to reject the null hypothesisarrow_forwardSelect all the studies where the explanatory variable is measured at the same time as the outcome variable. Clinical Trial Case-Control Cross-Sectional Cohort A survey where a large portion of those under the age of 25 in the sample did not answer the questions about drug use is an example of what type of bias? Selection Measurement Respone Non-Response When the population of interest is everyone in a high school, but only people who attend the sporting events are recruited into the sample, this is an example of what kind of bias? Selection Measurement Respone Non-Responsearrow_forwardIllustrate the null hypothesis for a correlated t test?arrow_forward
- Work Conduct the hypothesis test and provide the test statistic and the critical value, and state the conclusion. A person drilled a hole in a die and filled it with a lead weight, then proceeded to roll it 200 times. Here are the observed frequencies for the outcomes of 1, 2, 3, 4, 5, and 6, respectively: 27, 29, 50, 41, 29, 24. Use a 0.10 significance level to test the claim that the outcomes are not equally likely. Does it appear that the loaded die behaves differently than a fair die? Click here to view the chi-square distribution table. The test statistic is. (Round to three decimal places as needed.) The critical value is (Round to three decimal places as needed.) State the conclusion. Ho- There sufficient evidence to support the claim that the outcomes are not equally likely. The outcomes to be equally likely, so the loaded die to behave differently from a fair die.arrow_forwardFind the test statistic for this hypothesis test. Z= Determine the P Value P-Value=arrow_forwardA research study wanted to examine whether religious belief and gender are related in their state. They selected a representative sample of men and women in their State.Select the null and alternative hypothesis of the test: H0: there is no relationship between gender and belief about human originsHa: there is a relationship between gender and belief about human origins H0: there is a relationship between gender and belief about human originsHa: there is no relationship between gender and belief about human origins Results of the study are summarized in this table for the Belief about human origins: religious texts evolutionary theory total male 30 36 66 female 110 89 199 total 140 125 265 The degrees of freedom for the the ?2 statistic are Round the following numbers to two places after the decimal:The test statistic is ?2 = with a p-value = The conclusion of the test at the 5% significance level is There is not enough statistical evidence to suggest that gender…arrow_forward
 Calculus For The Life SciencesCalculusISBN:9780321964038Author:GREENWELL, Raymond N., RITCHEY, Nathan P., Lial, Margaret L.Publisher:Pearson Addison Wesley,