
Videos
Testing the Difference Between Two Means In Exercises 9–20, (a) identify the claim and state H0 and Ha, (b) find the critical value(s) and identify the rejection region(s), (c) calculate
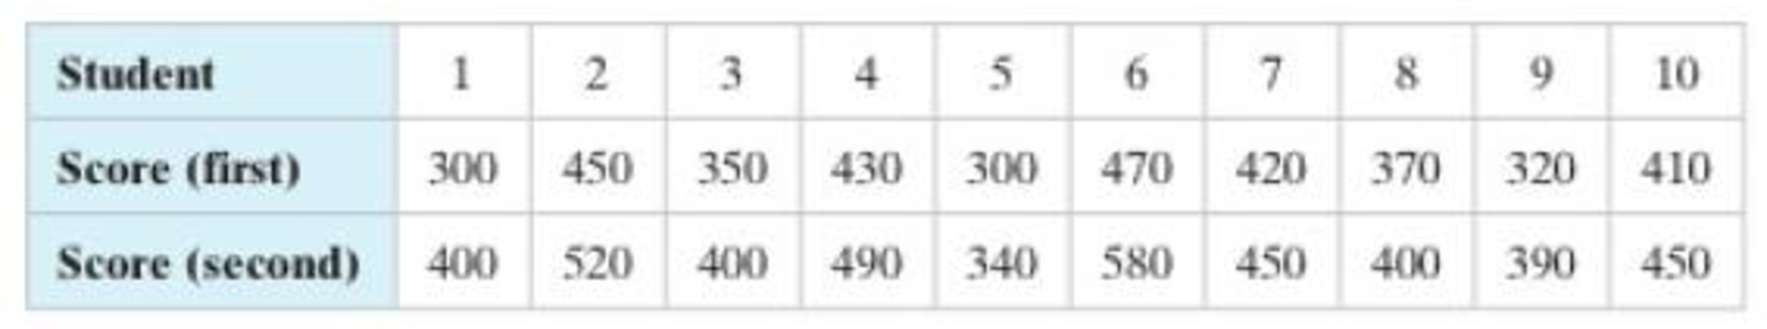
10. SAT Scores An instructor for a SAT preparation course claims that the course will improve the test scores of students. The table shows the critical reading scores for 10 students the first two times they took the SAT. Before taking the SAT for the second time, the students took the instructor’s course to try to improve their critical reading SAT scores. At α = 0.01, is there enough evidence to support the instructor’s claim?
Want to see the full answer?
Check out a sample textbook solution
Chapter 8 Solutions
Elementary Statistics: Picturing the World (7th Edition)


- (a) Identify the claim and state H0 and Ha.What is the claim? Let Region A be sample 1 and let Region B be sample 2. Identify H0 and Ha. (b) Find the critical value(s) and identify the rejection region. What is the rejection region? (c) Find the standardized test statistic z. (d) Decide whether to reject or fail to reject the null hypothesis and interpret the decision in the context of the original claim.arrow_forwardTest the claim that the mean GPA of night students is significantly different than the mean GPA of day students at the 0.05 significance level. The null and alternative hypothesis would be: Ho:PN 2 PD Ho:PN = PD Ho: PN PD H1:UN > HD H1:uN Next Question M hparrow_forwardTest the claim that the mean GPA of Orange Coast students is smaller than the mean GPA of Coastline students at the 0.01 significance level. The null and alternative hypothesis would be: Ho:Po = Pc Ho:Po > Pc Ho:µ0 µc H1: Ho Pc H1:µo + HC The test is: two-tailed left-tailed right-tailed The sample consisted of 55 Orange Coast students, with a sample mean GPA of 3.46 and a standard deviation of 0.08, and 55 Coastline students, with a sample mean GPA of 3.49 and a standard deviation of 0.07. The test statistic is: (to 2 decimals) The p-value is: (to 2 decimals) Based on this we: O Fail to reject the null hypothesis Reject the null hypothesisarrow_forward
- Test the claim that the proportion of people who own cats is larger than 20% at the 0.005 significance level. The null and alternative hypothesis would be: H2:p = 0.2 Họ:p 2 0.2 H9:p 0.2 H9:p = 0.2 Hg: u 0.2 H1: u 0.2 The test is: left-tailed two-tailed right-tailed Based on a sample of 300 people, 24% owned cats The test statistic is: (to 2 decimals) The p-value is: (to 2 decimals) Based on this we: O Reject the null hypothesis O Fail to reject the null hypothesisarrow_forwardWork Conduct the hypothesis test and provide the test statistic and the critical value, and state the conclusion. A person drilled a hole in a die and filled it with a lead weight, then proceeded to roll it 200 times. Here are the observed frequencies for the outcomes of 1, 2, 3, 4, 5, and 6, respectively: 27, 29, 50, 41, 29, 24. Use a 0.10 significance level to test the claim that the outcomes are not equally likely. Does it appear that the loaded die behaves differently than a fair die? Click here to view the chi-square distribution table. The test statistic is. (Round to three decimal places as needed.) The critical value is (Round to three decimal places as needed.) State the conclusion. Ho- There sufficient evidence to support the claim that the outcomes are not equally likely. The outcomes to be equally likely, so the loaded die to behave differently from a fair die.arrow_forwardTest the claim that the proportion of people who own cats is larger than 10% at the 0.10 significance level.The null and alternative hypothesis would be: H0:p=0.1 Ha:p>0.1 The test is right tailed Based on a sample of 300 people, 14% owned catsThe test statistic is: (to 2 decimals)The p-value is: (to 2 decimals)arrow_forward
- Test the claim that the proportion of people who own cats is smaller than 80% at the 0.10 significance level. The null and alternative hypothesis would be: 0.8 Но: д — 0.8 Но:д 0.8 Но:р > 0.8 Нo:р H1: µ 0.8 H1:p > 0.8 The test is: left-tailed right-tailed two-tailed Based on a sample of 800 people, 73% owned cats The p-value is: (to 2 decimals) Based on this we: O Reject the null hypothesis Fail to reject the null hypothesisarrow_forwardQuestion below pleasearrow_forwardData set presents a sample of the number of defective flash drives produced by a small manufacturing company over the last 30 weeks. The company's operations manager believes that the number of defects produced by the process is less than seven defective flash drives per week. Construct a hypothesis test to verify the operations manager's claim. Hypothesis test should include a t test statistic value, a p value, a decision, and a conclusion. This is the null and alternative hypotheses (see attachment): Data: Mean 7.0300 SD 1.3700 SEM 0.2501 N 30arrow_forward
- Data set presents a sample of the number of defective flash drives produced by a small manufacturing company over the last 30 weeks. The company's operations manager believes that the number of defects produced by the process is less than seven defective flash drives per week. Construct a hypothesis test to verify the operations manager's claim. Hypothesis test should include a t test statistic value, a p value, a decision, and a conclusion. This is the null hypotheses (see attachment): Data: Mean 7.0300 SD 1.3700 SEM 0.2501 N 30arrow_forwardTesting Claims About Proportions. In Exercises 7–22, test the given claim. Identify the null hypothesis, alternative hypothesis, test statistic, P-value or critical value(s), then state the conclusion about the null hypothesis, as well as the final conclusion that addresses the original claim. Cell Phones and Handedness A study was conducted to investigate the association between cell phone use and hemispheric brain dominance. Among 216 subjects who prefer to use their left ear for cell phones, 166 were right-handed. Among 452 subjects who prefer to use their right ear for cell phones, 436 were right-handed (based on data from “Hemispheric Dominance and Cell Phone Use,” by Seidman et al., JAMA Otolaryngology—Head & Neck Surgery, Vol. 139, No. 5). We want to use a 0.01 significance level to test the claim that the rate of right-handedness for those who prefer to use their left ear for cell phones is less than the rate of right-handedness for those who prefer to use their right ear…arrow_forwardH0: p1=p2 H1: p1<p2 1) Identify the test statistic. 2)Identify the P-value.arrow_forward
 MATLAB: An Introduction with ApplicationsStatisticsISBN:9781119256830Author:Amos GilatPublisher:John Wiley & Sons Inc
 Probability and Statistics for Engineering and th...StatisticsISBN:9781305251809Author:Jay L. DevorePublisher:Cengage Learning
 Statistics for The Behavioral Sciences (MindTap C...StatisticsISBN:9781305504912Author:Frederick J Gravetter, Larry B. WallnauPublisher:Cengage Learning
 Elementary Statistics: Picturing the World (7th E...StatisticsISBN:9780134683416Author:Ron Larson, Betsy FarberPublisher:PEARSON
 The Basic Practice of StatisticsStatisticsISBN:9781319042578Author:David S. Moore, William I. Notz, Michael A. FlignerPublisher:W. H. Freeman
 Introduction to the Practice of StatisticsStatisticsISBN:9781319013387Author:David S. Moore, George P. McCabe, Bruce A. CraigPublisher:W. H. Freeman