
PRIN.OF CORPORATE FINANCE
13th Edition
ISBN: 9781260013900
Author: BREALEY
Publisher: RENT MCG
expand_more
expand_more
format_list_bulleted
Concept explainers
Videos
Textbook Question
Chapter 7, Problem 18PS
Portfolio risk Table 7.8 shows standard deviations and correlation coefficients for seven
stocks from different countries. Calculate the variance of a portfolio with equal investments
in each stock.
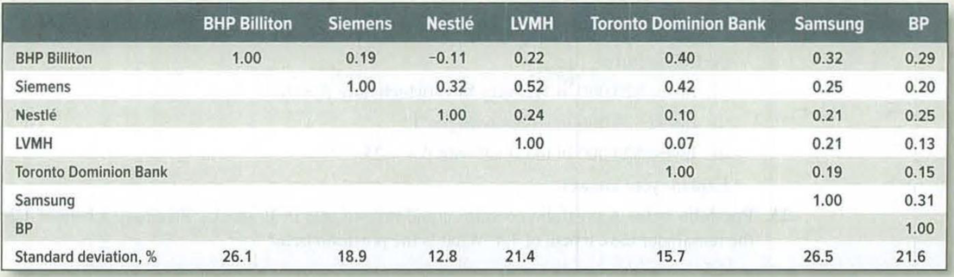
TABLE 7.8 Standard deviations of returns and correlation coefficients for a sample of seven stocks
Expert Solution & Answer
Want to see the full answer?
Check out a sample textbook solution
Students have asked these similar questions
Question 1
Refer to the following observations for stock A and the market portfolio in the table:Month Stock A Market portfolio1 0.30 0.122 0.24 0.083 -0.04 -0.104 0.10 -0.025 0.06 0.086 0.10 0.07
a) Calculate the main statistic measures to explain the relationship between stock A and the market portfolio:• The sample covariance between rate of return for the stock A and the market;• The sample Beta factor of stock A;• The sample correlation coefficient between the rates of return of the stock A and the market
QUESTION 1
Under which of the following scenarios, the minimum variance portfolio that contains two stocks has the smallest standard deviation?
OA. The correlation between the two stock returns is -1
OB. The correlation between the two stock returns is -0.2
OC. The correlation between the two stock returns is 0.2
OD. The correlation between the two stock returns is 0.5
Calculate the correlation coefficient for the portfolio using the following information:
Variance of Stock X 0.08 Variance of Stock Y 0.06
Covariance is 0.05
a. 0.1042
b. 0.7217
c. 0.00024
d. 0.0693
Chapter 7 Solutions
PRIN.OF CORPORATE FINANCE
Ch. 7 - Rate of return The level of the Syldavia market...Ch. 7 - Real versus nominal returns The Costaguana stock...Ch. 7 - Arithmetic average and compound returns Integrated...Ch. 7 - Risk premiums Here are inflation rates and U.S....Ch. 7 - Risk Premium Suppose that in year 2030, investors...Ch. 7 - Stocks vs. bonds Each of the following statements...Ch. 7 - Expected return and standard deviation A game of...Ch. 7 - Standard deviation of returns The following table...Ch. 7 - Average returns and standard deviation During the...Ch. 7 - Prob. 10PS
Ch. 7 - Prob. 11PSCh. 7 - Diversification Here are the percentage returns on...Ch. 7 - Risk and diversification In which of the following...Ch. 7 - Prob. 14PSCh. 7 - Portfolio risk To calculate the variance of a...Ch. 7 - Portfolio risk a) How many variance terms and how...Ch. 7 - Portfolio risk Table 7.8 shows standard deviations...Ch. 7 - Portfolio risk Hyacinth Macaw invests 60% of her...Ch. 7 - Stock betas What is the beta of each of the stocks...Ch. 7 - Stock betas There are few, if any, real companies...Ch. 7 - Portfolio betas A portfolio contains equal...Ch. 7 - Portfolio betas Suppose the standard deviation of...Ch. 7 - Portfolio risk Here are some historical data on...Ch. 7 - Portfolio risk Suppose that Treasury bills offer a...
Knowledge Booster


Learn more about
Need a deep-dive on the concept behind this application? Look no further. Learn more about this topic, finance and related others by exploring similar questions and additional content below.Similar questions
- Expected return of a portfolio using beta. The beta of four stocks—P, Q, R, and S—are 0.49, 0.81, 1.19, and 1.53, respectively and the beta of portfolio 1 is 1.01, the beta of portfolio 2 is 0.86, and the beta of portfolio 3 is 1.15. What are the expected returns of each of the four individual assets and the three portfolios if the current SML is plotted with an intercept of 4.5% (risk-free rate) and a market premium of 12.0% (slope of the line)? What is the expected return of stock P? (Round to two decimal places.) What is the expected return of stock Q? (Round to two decimal places.) What is the expected return of stock R? (Round to two decimal places.) What is the expected return of stock S? (Round to two decimal places.) What is the expected return of portfolio 1? (Round to two decimal places.) What is the expected return of portfolio 2? (Round to two decimal places.) What is the expected return of portfolio 3?…arrow_forwardKindly answer 11 and 12 Using the stock price data for any two companies provided below carry out the following tasks: 1.Compute, for each asset: i.Total Returns ii.Expected returns iii.standard deviation iv.Correlation Coefficient 2.Construct the variance-covariance matrix 3.Construct equally weighted portfolio and calculate Expected Return, Standard Deviation and Sharpe ratio. 4.Reconstruct equally weighted portfolio and calculate Expected Return, Standard Deviation and Sharpe ratio. 5.Use Solver to determine optimal risky portfolio. 6.Create hypothetical portfolios (commencing from Weight A=0 and weight B=100) 7.Calculate Expected return and Standard Deviation for all the above combinations 8.Graph the efficient frontier 9.Graph the optimal portfolio 10.Assuming that the investors prefers lower level of risk than what a portfolio of risky assets offer, introduce a risk free asset in the portfolio with a return of 3% 11.Using hypothetical weights (A= Portfolio of Risky Assets, B= 1…arrow_forwardPLEASE EXPLAIN HOW ANSWERS WERE FOUND Using the data in the following table,calculate the volatility (standard deviation) of a portfolio that 54% is invested in stock A and 46% in stock B.arrow_forward
- From the following information, calculate covariance between stocks A and B and expected return and risk of a portfolio in which A and B are equally weighted.Which stock would be recommend if investment in individual stock is to be made? Justify answer using numerical calculations. Stock A Stock B Expected return 24% 35% Standard deviation 12% 18% Coefficient of correlation 0.65 0.65arrow_forwardFrom the following information, calculate covariance between stocks A and B and expected return and risk of a portfolio in which A and B are equally weighted.Which stock would be best recommend if investment in individual stock is to be made? Justify the answer using numerical calculations. Stock A Stock B Expected return 24% 35% Standard deviation 12% 18% Coefficient of correlation 0.65arrow_forwardExpected return of a portfolio using beta. The beta of four stocks—G, H, I, and J—are 0.44, 0.75, 1.21, and 1.55, respectively and the beta of portfolio 1 is 0.99, the beta of portfolio 2 is 0.83, and the beta of portfolio 3 is 1.14. What are the expected returns of each of the four individual assets and the three portfolios if the current SML is plotted with an intercept of 3.5% (risk-free rate) and a market premium of 10.0% (slope of the line) What is the expected return of portfolio 1? (Round to two decimal places.) What is the expected return of portfolio 2? (Round to two decimal places.) What is the expected return of portfolio 3? (Round to two decimal places.)arrow_forward
- Expected return of a portfolio using beta. The beta of four stocks—G, H, I, and J—are 0.44, 0.75, 1.21, and 1.55, respectively and the beta of portfolio 1 is 0.99, the beta of portfolio 2 is 0.83, and the beta of portfolio 3 is 1.14. What are the expected returns of each of the four individual assets and the three portfolios if the current SML is plotted with an intercept of 3.5% (risk-free rate) and a market premium of 10.0% (slope of the line)? What is the expected return of stock G? (Round to two decimal places.) What is the expected return of stock H? (Round to two decimal places.) What is the expected return of stock I? (Round to two decimal places.) What is the expected return of stock J? (Round to two decimal places.) What is the expected return of portfolio 1? (Round to two decimal places.) What is the expected return of portfolio 2? (Round to two decimal places.) What is the expected return of portfolio 3?…arrow_forward1.2. Refer to the following observations for stock A and the market portfolio in the table: Month Rate of return Stock A Market portfolio 1 0.30 0,12 0.24 0,08 3 -0,04 -0,10 -0,02 0,08 0,07 4 0,10 5 0,06 6 0,10 a) Calculate the main statistic measures to explain the relationship between stock A and the market portfolio: i) The sample covariance between rate of return for the stock A and the market. ii) The sample Beta factor of stock A. iii) The sample correlation coefficient between the rates of return of the stock A and the market. iv) The sample coefficient of determination associated with the stock A and the mar- ket. b) Draw in the characteristic line of the stock A and give the interpretation - what does it show for the investor? c) Calculate the sample residual variance associated with stock's A characteristic line and explain how the investor would interpret the number of this statistic. d) Do you recommend this stock for the investor with the lower tolerance of risk?arrow_forwardFrom the information attached below, calculate: a. the average stock return from 20x1- 20x3. b. The standard deviation over the same period.arrow_forward
- Calculate the expected return, variance, and standard deviation for a portfolio of four equally weighted stocks with returns of 26.4%, -9.2%, 2.9%, and 22.0%arrow_forwardConsider two stocks, Stock D with an expected return of 21 percent and a standard deviation of 36 percent and Stock I, an international company, with an expected return of 9 percent and a standard deviation of 24 percent. The correlation between the two stocks is -22. What are the expected return and standard deviation of the minimum variance portfolio? (Round your answer to 2 decimal places. Omit the "%" sign in your response.) Expected return Standard deviation % %arrow_forwardThe correlation coefficient between stock B and the market portfolio is 0.8. The standard deviation of stock B is 24 percent and the standard deviation of the market is 30 percent. Calculate the beta of the stock. 0.64 0.92 0.80 1.00 1.42arrow_forward
arrow_back_ios
SEE MORE QUESTIONS
arrow_forward_ios
Recommended textbooks for you
 Intermediate Financial Management (MindTap Course...FinanceISBN:9781337395083Author:Eugene F. Brigham, Phillip R. DavesPublisher:Cengage Learning
 EBK CONTEMPORARY FINANCIAL MANAGEMENTFinanceISBN:9781337514835Author:MOYERPublisher:CENGAGE LEARNING - CONSIGNMENT
Intermediate Financial Management (MindTap Course...
Finance
ISBN:9781337395083
Author:Eugene F. Brigham, Phillip R. Daves
Publisher:Cengage Learning
EBK CONTEMPORARY FINANCIAL MANAGEMENT
Finance
ISBN:9781337514835
Author:MOYER
Publisher:CENGAGE LEARNING - CONSIGNMENT
Portfolio return, variance, standard deviation; Author: MyFinanceTeacher;https://www.youtube.com/watch?v=RWT0kx36vZE;License: Standard YouTube License, CC-BY