
PRIN.OF CORPORATE FINANCE
13th Edition
ISBN: 9781260013900
Author: BREALEY
Publisher: RENT MCG
expand_more
expand_more
format_list_bulleted
Concept explainers
Videos
Textbook Question
Chapter 7, Problem 12PS
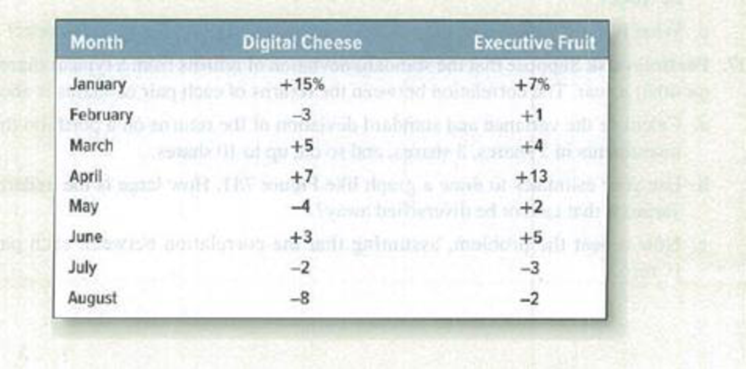
Diversification* Here are the percentage returns on two stocks,
- a) Calculate the monthly variance and standard deviation of each stock. Which stock is the riskier if held oil its own?
- b) Now calculate the variance and standard deviation of the returns on a portfolio that invests an equal amount each month in the two stocks.
- c) Is the variance more or less than half way between the variance of the two individual stocks?
Expert Solution & Answer
Want to see the full answer?
Check out a sample textbook solution
Students have asked these similar questions
Based on the following information, calculate the expected return and standard deviation for
each of the following stocks. What are the covariance and correlation between the returns of
the two stocks? Calculate the portfolio return and portfolio standard deviation if
you invest
equally in each asset.
Returns
State of Economy
Prob
J
K
Recession
0.25
-0.02
0.034
Normal
0.6
0.138
0.062
Boom
0.15
0.218
0.092
Consider the rate of return of stocks ABC and XYZ.
Year
rABC
rXYZ
1
20
%
28
%
2
8
11
3
16
19
4
4
1
5
2
−9
(PLEASE SKIP THE FIRST THREE QUESTIONS)
a. Calculate the arithmetic average return on these stocks over the sample period.
b. Which stock has greater dispersion around the mean return?
multiple choice
A. ABC
B. XYZ
c. Calculate the geometric average returns of each stock. What do you conclude? (Do not round intermediate calculations. Round your answers to 2 decimal places.)
d. If you were equally likely to earn a return of 20%, 8%, 16%, 4%, or 2%, in each year (these are the five annual returns for stock ABC), what would be your expected rate of return? (Do not round intermediate calculations.)
e. What if the five possible outcomes were those of stock XYZ?
f. Given your answers to (d) and (e), which measure of average return, arithmetic or geometric, appears more useful for predicting future…
a. Based on the following information, calculate the expected return and standard deviation for
each of the following stocks. What are the covariance and correlation between the returns of
the two stocks? Calculate the portfolio return and portfolio standard deviation if you invest
equally in each asset.
Returns
State of Economy
Prob
K
Recession
0.25
-0.02
0.034
Normal
0.6
0.138
0.062
Boom
0.15
0.218
0.092
b. A portfolio that combines the risk-free asset and the market portfolio has an expected return of
7 percent and a standard deviation of 10 percent. The risk-free rate is 4 percent, and the
expected return on the market portfolio is 12 percent. Assume the capital asset pricing model
holds. What expected rate of return would a security earn if it had a .45 correlation with the
market portfolio and a standard deviation of 55 percent?
c. Suppose the risk-free rate is 4.2 percent and the market portfolio has an expected return of 10.9
percent. The market portfolio has a variance of…
Chapter 7 Solutions
PRIN.OF CORPORATE FINANCE
Ch. 7 - Rate of return The level of the Syldavia market...Ch. 7 - Real versus nominal returns The Costaguana stock...Ch. 7 - Arithmetic average and compound returns Integrated...Ch. 7 - Risk premiums Here are inflation rates and U.S....Ch. 7 - Risk Premium Suppose that in year 2030, investors...Ch. 7 - Stocks vs. bonds Each of the following statements...Ch. 7 - Expected return and standard deviation A game of...Ch. 7 - Standard deviation of returns The following table...Ch. 7 - Average returns and standard deviation During the...Ch. 7 - Prob. 10PS
Ch. 7 - Prob. 11PSCh. 7 - Diversification Here are the percentage returns on...Ch. 7 - Risk and diversification In which of the following...Ch. 7 - Prob. 14PSCh. 7 - Portfolio risk To calculate the variance of a...Ch. 7 - Portfolio risk a) How many variance terms and how...Ch. 7 - Portfolio risk Table 7.8 shows standard deviations...Ch. 7 - Portfolio risk Hyacinth Macaw invests 60% of her...Ch. 7 - Stock betas What is the beta of each of the stocks...Ch. 7 - Stock betas There are few, if any, real companies...Ch. 7 - Portfolio betas A portfolio contains equal...Ch. 7 - Portfolio betas Suppose the standard deviation of...Ch. 7 - Portfolio risk Here are some historical data on...Ch. 7 - Portfolio risk Suppose that Treasury bills offer a...
Knowledge Booster


Learn more about
Need a deep-dive on the concept behind this application? Look no further. Learn more about this topic, finance and related others by exploring similar questions and additional content below.Similar questions
- Question; In considering the purchase of a certain stock, you attach the following probabilities to possible changes in the stock price over the next year. What is the expected value, the variance, and the standard deviation? Which is the most likely outcome? please use the tablearrow_forward2. Let random variables A and B be the monthly returns of stocks A and B, respectively. Let C be the monthly returns of Crude Oil Index (WTI). Suppose p(A,C) = correlation between A and C= 0.50 p(B,C) = correlation between B and C= -0.45 • p(A,B) = correlation between A and B = -0.15 o(A) = standard deviation of A = 0.45 o(B) = standard deviation of B = 0.75 o(C) = standard deviation of C= 0.55 Moreover, suppose you decided to form a portfolio D, which invests 60% in stock A and 40% in stock B. Let random variable D be the monthly returns of portfolio D. a. b. C. Y : Determine the covariances between (i.) A and C, (ii.) B and C, and, (iii.) A and B. Compute for the covariance between C and D. Compute for the expected standard deviation of D.arrow_forwardThe table below presents the returns on stocks ABC and XYZ for a five-year period. Year ABC XYZ 1 0.16 0.12 2 0.42 0.62 3 -0.02 -0.23 4 -0.26 -0.62 5 0.48 0.52 Calculate the average return, and standard deviation of stock ABC and XYZ. Also calculate the correlation between the two stocks. What does the correlation tell you about the return movements of the two stocks? Calculate the weight of each stock in the minimum variance portfolio, assume the expected return equals to average return for each stock. Find the mix of stocks ABC and XYZ that gives a portfolio on the efficient frontier AND demonstrate why this portfolio is on the efficient frontier by showing that there exists another portfolio of stocks ABC and XYZ that has the same level of risk (portfolio standard deviation) but inferior return. Hint: manipulate the weights you get from part b. Suppose the risk-free rate is 6%. Also assume the…arrow_forward
- Consider the rate of return of stocks ABC and XYZ. Year rABC rXYZ 1 20 % 28 % 2 8 11 3 16 19 4 4 1 5 2 −9 a. Calculate the arithmetic average return on these stocks over the sample period. b. Which stock has greater dispersion around the mean return? A. ABC B. XYZ c. Calculate the geometric average returns of each stock. What do you conclude? (Do not round intermediate calculations. Round your answers to 2 decimal places.) d. If you were equally likely to earn a return of 20%, 8%, 16%, 4%, or 2%, in each year (these are the five annual returns for stock ABC), what would be your expected rate of return? (Do not round intermediate calculations.) e. What if the five possible outcomes were those of stock XYZ? f. Given your answers to (d) and (e), which measure of average return, arithmetic or geometric, appears more useful for predicting future performance? A. Arithmetic B. Geometricarrow_forwardWhat is the average annual return? b. What is the variance of the stock's returns? c. What is the standard deviation of the stock's returns? Note: Notice that the average return and standard deviation must be entered in percentage format. The variance must be entered in decimal format. Year 1 2 3 4 Return (%) Year1: -4.1% Year2: 27.6% Year 3: 12.3% Year 4: 3.6%arrow_forwarda. Based on the following information, calculate the expected return and standard deviation for each of the following stocks. What are the covariance and correlation between the returns of the two stocks? Calculate the portfolio returm and portfolio standard deviation if you invest equally in each asset. Returns State of Economy Prob J K Recession 0.25 -0.02 0.034 Normal 0.6 0.138 0.062 Boom 0.15 0.218 0.092 b. A portfolio that combines the risk-free asset and the market portfolio has an expected return of percent and a standard deviation of 10 percent. The risk-free rate is 4 percent, and the Page 7 of 33 expected return on the market portfolio is 12 percent. Assume the capital asset pricing model holds. What expected rate of return would a security earn if it had a 45 corelation with the market portfolio and a standard deviation of 55 percent? C. Suppose the risk-free rate is 4.2 percent and the market portfolıo has an expected return of 10.9 mercent Tibemadkat normfeliobasiabiamance…arrow_forward
- The last four years of returns for a stock are as shown here: LOADING... . a. What is the average annual return? b. What is the variance of the stock's returns? c. What is the standard deviation of the stock's returns? Note: Notice that the average return and standard deviation must be entered in percentage format. The variance must be entered in decimal format. Question content area bottom Part 1 a. What is the average annual return? The average return is enter your response here%. (Round to two decimal places.) Part 2 b. What is the variance of the stock's returns? The variance of the returns is enter your response here. (Round to five decimal places.) Part 3 c. What is the standard deviation of the stock's returns? The standard deviation is enter your response here%. (Round to two decimal places.) figure Year: 1, 2, 3, 4 Return: -4.2%, +27.9%, +11.8%, +3.8%arrow_forwardConsider information given in the table below and answers the question asked thereafter: State Probability return on stock A Return on stock B A 0.15 10% 9% B 0.15 6% 15% C 0.10 20% 10% D 0.18 5% -8% E 0.12 -10% 20% F 0.30 8% 5% Calculate covariance and coefficient of correlation between the returns of thestocks A and B.v. Now suppose you have $100,000 to invest and you want to a hold a portfoliocomprising of $45,000 invested in stock A and remaining amount in stock B.Calculate risk and return of your portfolio.arrow_forwardAttached in images are the returns on two stocks: a. Calculate the variance and standard deviation of each stock. (Do not round intermediate calculations. Round your answers to 2 decimal places.) Digital Cheese Return Executive Fruit Return Variance: Standard Deviation: b. Which stock is riskier if held on its own? Digital Cheese or Executive Fruit c. Now calculate the returns in each month of a portfolio that invests an equal amount each month in the two stocks. (Negative amounts should be indicated by a minus sign. Do not round intermediate calculations. Round your answers to 2 decimal places.) Jan. Feb. March April May June July August d. Is the variance more or less than halfway between the variance of the two individual stocks?arrow_forward
- The probability distribution of returns for the two stocks X and Y are as follows: Probability 0.1 0.3 0.05 0.25 0.15 0.15 For each of the two stocks, calculate: a. The expected return. b. Variance of returns c. Volatility of returns. Stock X 0.05 -0.1 0.08 -0.08 0.20 0.12 Return Stock Y 0.13 0,04 -0.12 0.21 0.1 -0.05arrow_forwardThe metric that is used to show the extent to which a given stock’s return move up and down with the stock market? a. Correlation b. Beta c. Standard deviation d. Expected returnarrow_forwardConsider the following average annual returns for Stocks A and B and the Market. Which of the possible answers best describes the historical betas for A and B? Years Market Stock A Stock B 1 0.03 0.16 0.05 2 −0.05 0.20 0.05 3 0.01 0.18 0.05 4 −0.10 0.25 0.05 5 0.06 0.14 0.05 a. bA > +1; bB = 0. b. bA = 0; bB = −1. c. bA < 0; bB = 0. d. bA < −1; bB = 1. e. bA > 0; bB = 1.arrow_forward
arrow_back_ios
SEE MORE QUESTIONS
arrow_forward_ios
Recommended textbooks for you
 Essentials Of InvestmentsFinanceISBN:9781260013924Author:Bodie, Zvi, Kane, Alex, MARCUS, Alan J.Publisher:Mcgraw-hill Education,

 Foundations Of FinanceFinanceISBN:9780134897264Author:KEOWN, Arthur J., Martin, John D., PETTY, J. WilliamPublisher:Pearson,
 Fundamentals of Financial Management (MindTap Cou...FinanceISBN:9781337395250Author:Eugene F. Brigham, Joel F. HoustonPublisher:Cengage Learning
 Corporate Finance (The Mcgraw-hill/Irwin Series i...FinanceISBN:9780077861759Author:Stephen A. Ross Franco Modigliani Professor of Financial Economics Professor, Randolph W Westerfield Robert R. Dockson Deans Chair in Bus. Admin., Jeffrey Jaffe, Bradford D Jordan ProfessorPublisher:McGraw-Hill Education
Essentials Of Investments
Finance
ISBN:9781260013924
Author:Bodie, Zvi, Kane, Alex, MARCUS, Alan J.
Publisher:Mcgraw-hill Education,
Foundations Of Finance
Finance
ISBN:9780134897264
Author:KEOWN, Arthur J., Martin, John D., PETTY, J. William
Publisher:Pearson,
Fundamentals of Financial Management (MindTap Cou...
Finance
ISBN:9781337395250
Author:Eugene F. Brigham, Joel F. Houston
Publisher:Cengage Learning
Corporate Finance (The Mcgraw-hill/Irwin Series i...
Finance
ISBN:9780077861759
Author:Stephen A. Ross Franco Modigliani Professor of Financial Economics Professor, Randolph W Westerfield Robert R. Dockson Deans Chair in Bus. Admin., Jeffrey Jaffe, Bradford D Jordan Professor
Publisher:McGraw-Hill Education
Dividend disocunt model (DDM); Author: Edspira;https://www.youtube.com/watch?v=TlH3_iOHX3s;License: Standard YouTube License, CC-BY