
Managerial Accounting (5th Edition)
5th Edition
ISBN: 9780134128528
Author: Karen W. Braun, Wendy M. Tietz
Publisher: PEARSON
expand_more
expand_more
format_list_bulleted
Videos
Textbook Question
Chapter 6, Problem 6.31AE
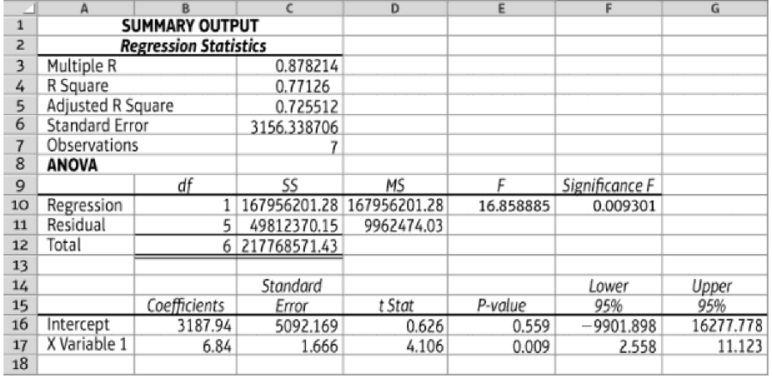
Using regression analysis output to predict
Using the data provided in E6-29A, the laboratory manager performed a regression analysis to predict total laboratory overhead costs. The output generated by Excel is as follows:
6.1-6.3 Full Alternative Text
Requirements
- 1. Determine the lab’s cost equation (use the output from the Excel regression).
- 2. Determine the R-square (use the output from the Excel regression).
- 3. Predict the total laboratory overhead for the month if 3,100 tests are performed.
Expert Solution & Answer
Want to see the full answer?
Check out a sample textbook solution
Students have asked these similar questions
a. Using the step method to allocate the service center costs, What is the total cost of Programming and classes?b. Using the direct method of allocating service center costs, Compute the total cost of Individual Fitnessc.Using the algebraic method of allocating service center costs Determine the total costs of Programming and Classes
Check image file for question
Q1a. Allocate the service department costs to the two operating departments using the direct method.
b.Allocate the service department cost to the two operating departments using ,I)the step-down method (Allocate administrative service first) . ii)the step down method (Allocoate Maintenance service first)
c. Assuming you are the manager of the Daily Patient department.Discuss which method of cost allocation would you prefer.Justify your decision
d.Mr Smith the financial controller of LabAid is convinced that the step-down method allocates more costs to the operating departments than the direct method.Do you agree with ,Mr Smith.Explain.
Learning Outcomes Addressed:
This assessment item addresses the following unit learning outcomes (ULOs) as described in the Unit Outline:
1. Clear understanding of various cost terms, cost behaviour and the role of overhead cost in pricing decisions
2. Ability to apply Activity Based Costing (ABC) techniques to an actual business in order to arrive at the most accurate costing for products.
requirement:
kindly adress these two question in detail. (please avoid any kind of plagorism and copy past and then paraphrasing )
Chapter 6 Solutions
Managerial Accounting (5th Edition)
Ch. 6 - (Learning Objective 1) A graph of a variable cost...Ch. 6 - (Learning Objective 2) Which of the following is...Ch. 6 - (Learning Objective 2) In the cost equation...Ch. 6 - Prob. 4QCCh. 6 - Prob. 5QCCh. 6 - (Learning Objective 3) Which of the following is...Ch. 6 - Prob. 7QCCh. 6 - (Learning Objective 5) Which of the following is...Ch. 6 - Prob. 9QCCh. 6 - Prob. 10QC
Ch. 6 - Identify cost behavior (Learning Objectives 1 2)...Ch. 6 - Prob. 6.2SECh. 6 - Compute fixed costs per unit (Learning Objective...Ch. 6 - Prob. 6.4SECh. 6 - Predict and graph total mixed costs (Learning...Ch. 6 - Prob. 6.6SECh. 6 - Prepare and analyze a scatterplot (Learning...Ch. 6 - Prob. 6.8SECh. 6 - Use the high-low method (Learning Objective 4)...Ch. 6 - Prob. 6.10SECh. 6 - Prob. 6.11SECh. 6 - Prob. 6.12SECh. 6 - Write a cost equation given regression output...Ch. 6 - Prepare a contribution margin income statement...Ch. 6 - Prepare income statements using variable costing...Ch. 6 - Prepare income statements using variable costing...Ch. 6 - Identify cost behavior graph (Learning Objectives...Ch. 6 - Prob. 6.18SECh. 6 - Prob. 6.19SECh. 6 - Prob. 6.20AECh. 6 - Prepare income statement in two formats (Learning...Ch. 6 - Prob. 6.22AECh. 6 - Prob. 6.23AECh. 6 - Sustainability and cost estimation (Learning...Ch. 6 - Create a scatterplot (Learning Objective 3) Melody...Ch. 6 - Continuation of E6-25A: High-low method (Learning...Ch. 6 - Continuation of E6-25A: Regression analysis...Ch. 6 - Regression analysis using Excel output (Learning...Ch. 6 - Prob. 6.29AECh. 6 - Using the high-low method to predict overhead for...Ch. 6 - Using regression analysis output to predict...Ch. 6 - Performing a regression analysis to predict...Ch. 6 - Prob. 6.33AECh. 6 - Prob. 6.34AECh. 6 - Compare absorption and variable costing (Learning...Ch. 6 - Prepare a contribution margin income statement...Ch. 6 - Prepare a contribution margin income statement...Ch. 6 - Prepare income statements using variable costing...Ch. 6 - Prepare a variable costing income statement given...Ch. 6 - Prob. 6.40AECh. 6 - Prob. 6.41BECh. 6 - Prepare income statement in two formats (Learning...Ch. 6 - Use unit cost data to forecast total costs...Ch. 6 - Prob. 6.44BECh. 6 - Sustainability and cost estimation (Learning...Ch. 6 - Create a scatter plot (Learning Objective 3) Tammy...Ch. 6 - Continuation of E6-46B: High-low method (Learning...Ch. 6 - Prob. 6.48BECh. 6 - Prob. 6.49BECh. 6 - Prob. 6.50BECh. 6 - Using the high-low method to predict overhead for...Ch. 6 - Using regression analysis output to predict...Ch. 6 - Prob. 6.53BECh. 6 - Prob. 6.54BECh. 6 - Prob. 6.55BECh. 6 - Prob. 6.56BECh. 6 - Prob. 6.57BECh. 6 - Prob. 6.58BECh. 6 - Prob. 6.59BECh. 6 - Prepare a variable costing income statement given...Ch. 6 - Prob. 6.61BECh. 6 - Analyze cost behavior at a hospital using various...Ch. 6 - Analyze cost behavior (Learning Objectives 1, 2,...Ch. 6 - Prob. 6.64APCh. 6 - Prob. 6.65APCh. 6 - Prob. 6.66APCh. 6 - Analyze cost behavior at a hospital using various...Ch. 6 - Analyze cost behavior (Learning Objectives 1, 2,...Ch. 6 - Prepare traditional and contribution margin income...Ch. 6 - Prob. 6.70BPCh. 6 - Prob. 6.71BPCh. 6 - Prob. 6.72SCCh. 6 - Cost Behavior in Real Companies Choose a company...Ch. 6 - Ethics of building inventory (Learning Objective...Ch. 6 - Prob. 6.76ACT
Knowledge Booster


Learn more about
Need a deep-dive on the concept behind this application? Look no further. Learn more about this topic, accounting and related others by exploring similar questions and additional content below.Similar questions
- A marketing professor at Givens College is interested in the relationship between hours spent studying and total points earned in a course. Data collected on 156 students who took the course last semester are provided in the tile MktHrsPts. Develop a scatter chart for these data. What does the scatter chart indicate about the relationship between total points earned and hours spent studying? Develop an estimated regression equation showing how total points earned is related to hours spent studying. What is the estimated regression model? Test whether each of the regression parameters β0 and β1 is equal to zero at a 0.01 level of significance. What are the correct interpretations of the estimated regression parameters? Are these interpretations reasonable? How much of the variation in the sample values of total point earned does the model you estimated in part (b) explain? Mark Sweeney spent 95 hours studying. Use the regression model you estimated in part (b) to predict the total points Mark earned.arrow_forwardWhich of the following will give you the most accurate allocation between a cost's fixed component and variable component? a. Examination of a students’ registration forms for miscellaneous fees and tuition fees b. Use of the least squares method to allocate the cost of electricity c. Dividing the total cost on the water bill among the different departments based on direct labor hours d. Dividing the total cost of the postpaid plan using the high-low methodarrow_forwardWrite a paper on performance measurement systems by comparing and contrasting between traditional and contemporary performance measurement systems. Learners are required to refer to at least THREE published journal articles. Use APA format for in-text citations and references.arrow_forward
- Unk The costs of the Accounting Department at Central Hospital would be considered by the Surgery Department to be: A. a) direct costs. B. b) indirect costs. C. c) incremental costs. D. d) opportunity costs. E. e) sunk costs.arrow_forward1. Set up a table with columns for cumulative number of units, cumulative average time per unit in hours, and cumulative total in hours using the cumulative average time learning curve. Complete the table for 1,2,4, and 8 units. What is the cumulative total time in hours for 8 units? 2. Set up a table assuming an 80% cummulative avergae time learning curve. What is the cumulative total time in hours for 8 units? 3. What is the difference in variable cost of producing four units? (between the result using the 0.90 model and 0.80 model)arrow_forwardUsing the step method to allocate the service center costs, what is the total cost of programming and classes?arrow_forward
- TASK A. Problem Solving. Analyze the given problems and use the worksheet provided for your answers. 1) Amore Companyproducestwoproductsinasinglefactory.Thefollowingproductionandcostinformationhasbe endetermined: Model1 1,000 100 Model2 200 Unitsproduced Materialmoves(total) Testingtime(total) Directiaborhoursperunit 40 250 125 Thecontrollerhasdetermined totaloverhead to beP480,000.P140,000relatestomateriaimoves;P150,000relatestotesting;theremainderisr elatedtolabortime. a) If Amore uses direct labor hours to allocate overhead to ach model, what would overhead per unit be for Model 2? b) If Amore uses activity-based costing to allocate overhoad to each model, what would overhead per unit be for Model 2? 2) GLPower Company manufactures a line of high-end laundry equipment. The accountant has proposed changing from a traditional costing syslem to an activity-based costing system. The president is not convinced of making the changes, so he requests that the next large order for equipment…arrow_forwardQ-1)Prepare a scattergraph using the above data. Plot cost on the vertical axis and activity on the horizontal axis. Fit a line to your plotted points using a ruler.arrow_forwardThe Chapter 6 Form worksheet is to be used to create your own worksheet version of the Review Problem in the text. 2. Change all of the numbers in the data area of your worksheet so that it looks like this: If your formulas are correct, you should get the correct answers to the following questions. (a) What is the net operating income (loss) in Year 1 under absorption costing? (b) What is the net operating income (loss) in Year 2 under absorption costing? (c) What is the net operating income (loss) in Year 1 under variable costing? (d) What is the net operating income (loss) in Year 2 under variable costing? (e) The net operating income (loss) under absorption costing is less than the net operating income (loss) under variable costing in Year 2 because: (You may select more than one answer. Single click the box with the question mark to produce a check mark for a correct answer and double click the box with the question mark to empty the box for a wrong answer.…arrow_forward
- Using the data in E4-2 and spreadsheet software, determine: The variable cost per unit, the total fixed cost, and R2. The plotted data points using the graphing function. Compare the results to your solutions in E4-2 and E4-3 and explain the reasons for the results.arrow_forwardAssume there are 3,600 cases in the validation dataset, and 12% of these cases have a value of 1 for churn (the primary/positive event). Questions a) to c) are based on data for the 3,600 cases (see table below). Depth (% Contacted) Model Cumulative Gain Cumulative Lift Decision Tree 34.42 6.84 Logistic Regression Neural Network 20.19 4.01 34.62 6.88 Decision Tree Logistic Regression Neural Network 10 64.90 6.06 10 36.06 3.15 10 62.50 5.54 Decision Tree 15 73.96 1.82 Logistic Regression Neural Network 15 49.04 2.62 15 82.21 3.97 Decision Tree Logistic Regression 20 78.39 0.87 20 59.13 2.01 Neural Network 20 86.54 0.86 a) Which model has the highest Cumulative Lift at a depth of 20%? What is the lift? b) If the Cumulative Gain at a depth of 10% for the Decision Tree is converted to number of primary/positive event cases, what will be the number of cases? Show your calculation. c) If the Cumulative Gain at a depth of 15% for the Neural Network model is converted to number of…arrow_forwardChecklist of evidence required Finally, you should reflect on the results of your activity-based costing exercise, by: a) explaining how costs are categorised. b) identifying those cost areas that have the greatest impact on the profitability of the product that you have investigated. c) evaluating the reasons for producing an activity-based cost model. d) explain how ABC model used to improve profitability. A research and problem solving project to explore the costs associated with engineering activities and to complete an activity-based cost model for a product.arrow_forward
arrow_back_ios
SEE MORE QUESTIONS
arrow_forward_ios
Recommended textbooks for you
 Essentials of Business Analytics (MindTap Course ...StatisticsISBN:9781305627734Author:Jeffrey D. Camm, James J. Cochran, Michael J. Fry, Jeffrey W. Ohlmann, David R. AndersonPublisher:Cengage Learning
 Managerial Accounting: The Cornerstone of Busines...AccountingISBN:9781337115773Author:Maryanne M. Mowen, Don R. Hansen, Dan L. HeitgerPublisher:Cengage Learning
 Principles of Cost AccountingAccountingISBN:9781305087408Author:Edward J. Vanderbeck, Maria R. MitchellPublisher:Cengage Learning
 Essentials Of Business AnalyticsStatisticsISBN:9781285187273Author:Camm, Jeff.Publisher:Cengage Learning,
Essentials of Business Analytics (MindTap Course ...
Statistics
ISBN:9781305627734
Author:Jeffrey D. Camm, James J. Cochran, Michael J. Fry, Jeffrey W. Ohlmann, David R. Anderson
Publisher:Cengage Learning
Managerial Accounting: The Cornerstone of Busines...
Accounting
ISBN:9781337115773
Author:Maryanne M. Mowen, Don R. Hansen, Dan L. Heitger
Publisher:Cengage Learning
Principles of Cost Accounting
Accounting
ISBN:9781305087408
Author:Edward J. Vanderbeck, Maria R. Mitchell
Publisher:Cengage Learning
Essentials Of Business Analytics
Statistics
ISBN:9781285187273
Author:Camm, Jeff.
Publisher:Cengage Learning,
Relevant Costing Explained; Author: Kaplan UK;https://www.youtube.com/watch?v=hnsh3hlJAkI;License: Standard Youtube License