Concept explainers
Videos
Students in the materials class prepared three mortar mixes with water to cement ratios of 0.50, 0.55, and 0.60. Three 50-mm mortar cubes were prepared for each mix. The cubes were cured for 7 days and then tested for compressive strength. The test results were as shown in Table P6.16.
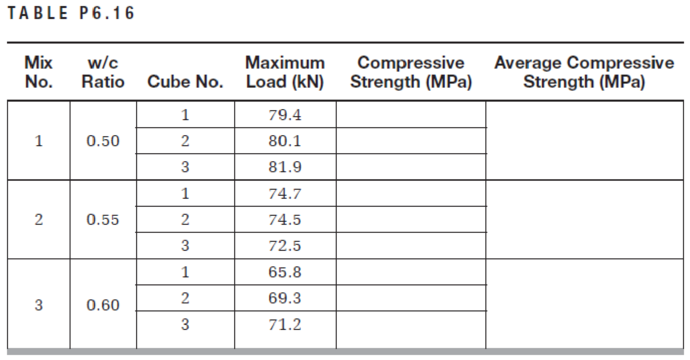
Determine the following:
a. The compressive strength of each cube.
b. The average compressive strength for each mix.
c. Plot the average compressive strength versus w/c ratios for all mixes.
d. Comment on the effect of increasing w/c ratio on the compressive strength of the cubes.
Want to see the full answer?
Check out a sample textbook solution
Chapter 6 Solutions
Materials for Civil and Construction Engineers (4th Edition)
Additional Engineering Textbook Solutions
Structural Analysis (10th Edition)
Elementary Surveying (14th Edition)
Foundation Design: Principles and Practices (3rd Edition)
Structural Steel Design (6th Edition)
Elementary Surveying: An Introduction To Geomatics (15th Edition)
EBK FUNDAMENTALS OF THERMODYNAMICS, ENH


- A concrete mix includes the following ingredients per cubic meter: Cement%3D400 kg Water=184 kg No admixture Table below shows possible alternatives mix ingredients. Indicate in the appropriate boxes in the table what will happen in each case for the workability and the ultimate compressive strength as increase, decrease or approximately the same. What will happen? Cement Water Admixture (kg) (kg) Ultimate compressive Workability strength 400 225 None 449 184 None Water 400 184 Reducer Water 400 128 Reducer 400 184 Super Plasticizer 400 184 Air Entrainer 400 184 Accelerator DFocusarrow_forward1.40 In a ready-mix plant, cylindrical samples are prepared and tested periodically to detect any mix problem and to ensure that the compressive strength is higher than the lower specification limit. The minimum target value was set at 5,000 psi. The following compressive strength data were collected. Compressive Strength (psi) Compressive Strength (psi) Sample No. Sample No. 1 5595 11 6695 2 5139 12 5449 6359 13 5278 4 5192 14 6697 5 5188 15 5195 6. 5241 16 6021 7 5964 17 5320 5875 18 5657 6155 19 6595 10 5115 20 5235 a. Calculate the mean, standard deviation, and the coefficient of variation of the data. b. Using a spreadsheet program, create a control chart for these data showing the target value and the lower specification limit. Is the plant production meeting the specification requirement? If not, comment on possible rea- sons. Comment on the data scatter.arrow_forwardTwo batches of concrete cylinders were made with and without a calcium chloride (CaCl2) accelerator admixture. Six cylinders were made of each batch and submerged in water for different times before testing for compressive strength and the results are shown in Table P6.34. It is required to do the following: a. Using an Excel sheet, plot the relationship between curing time and compressive strength of the two mixes on the same graph. Label all axes and curves. b. Comment on the effect of the accelerator on the compressive strength of PCC at early and late ages. TABLE P6.34 Cylinder no. 1 2 3 4 5 6 Water submergence (days) Compressive strength of plain concrete (MPa) Compressive strength of concrete with accelerator (MPa) 1 3 7 14 21 28 0.8 7.8 15.8 21.1 24.5 26.8 6.2 14.8 20.1 24.0 25.9 26.8arrow_forward
- Students in the materials class prepared three mortar mixes with water tocement ratios of 0.50, 0.55, and 0.60. Three 2-in. mortar cubes were preparedfor each mix. The cubes were cured for 7 days and then tested for compressivestrength. The test results were as shown in Table P6.17.Determine the following:a. The compressive strength of each cube.b. The average compressive strength for each mix.c. Plot the average compressive strength versus w/c ratios for all mixes.d. Comment on the effect of increasing w/c ratio on the compressive strengthof the cubes.arrow_forwardThree mortar mixes were prepared with water to cement ratios of 0.50, 0.55, and 0.60. Three 2-in. mortar cubes were prepared for each mix. The cubes were cured for 7 days and then tested for compressive strength. The test results were as shown in Table.Determine the following:a. The compressive strength of each cube.b. The average compressive strength for each mix. c. Plot the average compressive strength versus w/c ratios for all mixes.d. Comment on the effect of increasing w/c ratio on the compressive strength of the cubes.arrow_forwardFollowing is the given data of compressive strength test done on 2 inch cement mortar cubes: w/c Cube Maximum Load (lb) 17640 18270 17890 16350 16740 15990 14870 15260 15790 Ratio No. 0.50 0.55 2 0.60 Determine: a) Compressive strength of each cube. b) Average compressive strength for each mix. 312marrow_forward
- 3) Students in the materials lab mixed concrete with the following ingredients:9.7 kg of cement, 18.1 kg of sand, 28.2 kg of gravel, and 6.5 kg of water. The sand has a moisture content of 3.1% and an absorption of 4.2%. The gravel has a moisture content of 3.4% and an absorption of 4.4%. Since water absorbed in the aggregate does not react with the cement or improve the workability of the plastic concrete, what is the water–cement ratio of this mix according to the American Concrete Institute’s weight mix design method? If a water–cement ratio of 0.5 is required using the same materials and ingredients but different amount of mixing water, what is the weight of the mixing water to use?arrow_forwardThe results of a laboratory experiment to evaluate the effects of a plasticizer are shown.a. Calculate the water/cement in each of the three cases. b. Choose an appropriate case that - by using water reducer, how can we increase the compressive strength of concrete without changing workability? (Refer to the appropriate case in the table) c. Choose an appropriate case that - by using a water reducer, how can we improve workability without changingthe compressive strength? (Refer to the appropriate case in the table)d. Choose an appropriate case that - by using water reducer, how can we reduce cost without changing workability or strength? (Refer to the appropriate case in the table)arrow_forwardThree concrete mixes with the same ingredients, except the amount of mixing water, and their slump values were obtained. Three 150 mm * 300 mm concrete cylinders were prepared for each mix. The cylinders were cured for 7 days and then tested for compressive strength. The test results are as shown. Assume that the aggregate was at the saturated surface-dry condition before adding mixing water.It is required to do the following:a. Determine the compressive strength of each cylinder after 7 days.b. Determine the average compressive strength of each mix after 7 days.c. Determine the w/c ratio for each mix.arrow_forward
- Students in the materials lab mixed concrete with the following ingredients:9.7 kg of cement, 18.1 kg of sand, 28.2 kg of gravel, and 6.5 kg of water. The sand has a moisture content of 3.1% and an absorption of 4.2%. The gravel has a moisture content of 3.4% and an absorption of 4.4%. Since water absorbed in the aggregate does not react with the cement or improve the workability of the plastic concrete, what is the water–cement ratio of this mix according to the American Concrete Institute’s weight mix design method? If a water– cement ratio of 0.5 is required using the same materials and ingredients but different amount of mixing water, what is the mass of the mixing water to use?arrow_forward3. A concrete mix includes the following ingredients per cubic foot: (14 pts.) = 25 lbs. = 11 lbs. Cement Water No Admixture Table shows possible changes that can be made to the mix ingredients. Indicate in the appropriate boxes in the table what will happen in each case for the workability and the ultimate compressive strength as increase, decrease, or approximately the same. What WIlII Happen? Ultimate Compressive Strength Cement (Ib) Water (Ib) Admixture Workablity None 25 28 15 11 None Water reducer Water reducer Superplasticizer Air entrainer Accelerator 25 11 25 8. 25 11 25 11 25 11arrow_forwardA project specifies a concrete strength of at least 3000 psi. Materials engineers will design the mix for a strength higher than that. Calculate the required average compressive strength of the mix design if the standard deviation is s = 350 psi. Estimate the modulus of elasticity of the concrete at the required average compressive strength (the calculated strength, not the given strength).arrow_forward

 Structural Analysis (10th Edition)Civil EngineeringISBN:9780134610672Author:Russell C. HibbelerPublisher:PEARSON
 Principles of Foundation Engineering (MindTap Cou...Civil EngineeringISBN:9781337705028Author:Braja M. Das, Nagaratnam SivakuganPublisher:Cengage Learning
 Fundamentals of Structural AnalysisCivil EngineeringISBN:9780073398006Author:Kenneth M. Leet Emeritus, Chia-Ming Uang, Joel LanningPublisher:McGraw-Hill Education
 Traffic and Highway EngineeringCivil EngineeringISBN:9781305156241Author:Garber, Nicholas J.Publisher:Cengage Learning