
Loose Leaf for Foundations of Financial Management Format: Loose-leaf
17th Edition
ISBN: 9781260464924
Author: BLOCK
Publisher: Mcgraw Hill Publishers
expand_more
expand_more
format_list_bulleted
Concept explainers
Videos
Textbook Question
Chapter 6, Problem 17P
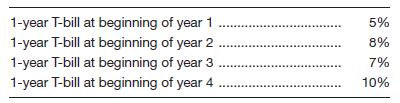
Using the expectations hypothesis theory for the term structure of interest rates, determine the expected return for securities with maturities of two, three, and four years based on the following data. Do an analysis similar to that in the right-hand portion of Table 6-6.
Expert Solution & Answer
Want to see the full answer?
Check out a sample textbook solution
Students have asked these similar questions
Assume these are the stock market and Treasury bill returns for a 5-year period: Required: a. What was the risk premium on common stock in each year? b. What was the average risk premium? c. What was the standard deviation of the risk premium? (Ignore that the estimation is from a sample of data.) Complete this question by entering your answers in the tabs below. What was the standard deviation of the risk premium? (Ignore that the estimation is from a sample of data.) Note: Do not round intermediate calculations. Enter your answer as a percent rounded to 2 decimal places.
Assume these are the stock market and Treasury bill returns for a 5-year period:
Required:
a. What was the risk premium on common stock in each year?
b. What was the average risk premium?
c. What was the standard deviation of the risk premium? (Ignore that the estimation is from a sample of data.)
Fill the parts in the above table that are shaded in yellow. You will notice that there are nineline items.
Using the data generated in the previous question (Question 1);a) Plot the Security Market Line (SML) b) Superimpose the CAPM’s required return on the SML c) Indicate which investments will plot on, above and below the SML?d) If an investment’s expected return (mean return) does not plot on the SML, what doesit show? Identify undervalued/overvalued investments from the graph
Please answer A, B, C & D
Chapter 6 Solutions
Loose Leaf for Foundations of Financial Management Format: Loose-leaf
Ch. 6 - Prob. 1DQCh. 6 - Prob. 2DQCh. 6 - Prob. 3DQCh. 6 - Prob. 4DQCh. 6 - “The most appropriate financing pattern would be...Ch. 6 - Prob. 6DQCh. 6 - Prob. 7DQCh. 6 - Prob. 8DQCh. 6 - What are three theories for describing the shape...Ch. 6 - Since the mid-1960s, corporate liquidity has been...
Ch. 6 - Gary’s Pipe and Steel Company expects sales next...Ch. 6 - Prob. 2PCh. 6 - Tobin Supplies Company expects sales next year to...Ch. 6 - Antivirus Inc. expects its sales next year to be...Ch. 6 - Prob. 5PCh. 6 - Prob. 6PCh. 6 - Boatler Used Cadillac Co. requires $850,000 in...Ch. 6 - Biochemical Corp. requires $550,000 in financing...Ch. 6 - Sauer Food Company has decided to buy a new...Ch. 6 - Assume that Hogan Surgical Instruments Co. has...Ch. 6 - Assume that Atlas Sporting Goods Inc. has $840,000...Ch. 6 - Colter Steel has $4,200,000 in assets. Short-term...Ch. 6 - Prob. 13PCh. 6 - Guardian Inc. is trying to develop an asset...Ch. 6 - Lear Inc. has $840,000 in current assets, $370,000...Ch. 6 - Using the expectations hypothesis theory for the...Ch. 6 - Using the expectations hypothesis theory for the...Ch. 6 - Carmen’s Beauty Salon has estimated monthly...Ch. 6 - Prob. 19PCh. 6 - Eastern Auto Parts Inc. has 15 percent of its...Ch. 6 - Bombs Away Video Games Corporation has forecasted...Ch. 6 - Esquire Products Inc. expects the following...
Knowledge Booster


Learn more about
Need a deep-dive on the concept behind this application? Look no further. Learn more about this topic, finance and related others by exploring similar questions and additional content below.Similar questions
- What is the stand-alone risk? Use the scenario data to calculate the standard deviation of the bonds return for the next year.arrow_forwardUse the investment opportunity set and data shown on the excel file attached. What will be the Weight of Bonds in the Optimum Portfolio, given this investment opportunity set? Round to two decimals. for example, 0.12arrow_forwardShow detailed steps to solve the following question. Consider a portfolio comprised of three securities in the following proportions and with the indicated security beta. a.) What is the portfolios beta? b.) Wht is the portfolios expected return?arrow_forward
- Using the return data on portfolios A and B provided in the accompanying spreadsheet, compute the return volatility for portfolio A. Round off your answer to three digits after the decimal point. State your answer as a percentage point, such as 1.234.arrow_forwardSuppose the returns on long-term corporate bonds and T-bills are normally distributed. Assume for a certain time period, long-term corporate bonds had an average return of 6.5 percent and a standard deviation of 8.5 percent. For the same period, T-bills had an average return of 3.3 percent and a standard deviation of 3.1 percent. Use the NORMDIST function in Excel to answer the following questions: a. What is the probability that in any given year, the return on long-term corporate bonds will be greater than 10 percent? Less than 0 percent? Note: Do not round intermediate calculations and enter your answers as a percent rounded to 2 decimal places, e.g., 32.16. b. What is the probability that in any given year, the return on T-bills will be greater than 10 percent? Less than 0 percent? Note: Do not round intermediate calculations and enter your answers as a percent rounded to 2 decimal places, e.g., 32.16. c. In 1979, the return on long-term corporate bonds was -4.18 percent. How…arrow_forwardProblem 3:Here are the annual returns for five different stocks. Determine the expected return and risk for a period of five years for each of the stocks. Problem 4:a. Find the coefficient of variation (CV) for each of the actions in problem 3.b. Explain which of the investments a risk averse investor would prefer and which a risk lover investor would prefer. Answer clearly and in detail. Show all the computations that led to the result.arrow_forward
- Assume that you are given the following partial covariance and correlation matrices for Securities J, K and the Market. Also assume that the expected risk-free rate for the coming year is 3.0 percent and that the expected risk premium on the market is 7.0 percent. Given this information, determine the required rate of return for Security J for the coming year, using CAPM. J Market Correlation J K Market Covariance J K Market Standard Deviation O 18.48% O 20.20% O 15.48% O 12.71% O 15.04% 0.44 0.86 J 0.014400 J K 0.64 K CAN 0.016900 K 1.00 Market 0.003600 Marketarrow_forwardYou are given the following partial covariance and correlation tables from historical data: Securities J K Market Securities J K Market 1.24 1.11 1.17 1.03 Covariance Matrix K 0.90 J 0.0020480 0.0021600 Also, you have estimated that the market's standard deviation is 4.3 percent. For the coming year, the expected return on the market is 14.0 percent and the risk-free rate is expected to be 4.0 percent. Given this information, determine the beta for Security K for the coming year, assuming CAPM is the correct model for required returns. Correlation Matrix K 0.60 1.00 0.90 1.00 0.60 0.80 Market 0.0020480 0.0021600 Market 0.80 0.90 1.00 Ston sharing Hidel lines Wearrow_forwardConsider the following information about two stocks (D and E) and two common risk factors (factor 1 and factor 2) Stock Risk factor 1 Risk factor 2 Expected return (%) D 1.2 3.4 13.1 2.6 2.6 15.4 a. Assuming that the risk free rate is 5%, determine the risk premium for factors 1 and 2 that are consistent with the expected returns for the two stocks. You expect that in one year the prices of Stock D and E will be $55 and $36 respectively and pay no dividends. What should be the price of each stock today to be consistent with the expected return levels. b. C. Determine how to you identified if Stock D and E are overvalued, fairly valued and undervalued? d. Suppose the risk premium for factor 1 as computed in (a) increases by 0.25 percent, what will be the new expected return for D and E? e. Suppose the risk premium for factor 1 as computed in (a) decreases by 0.25%, what will be the new expected return for D and E? f. Devise how would you develop a Jensen Index using Arbitrage Pricing…arrow_forward
- Bond valuation related problems should be solved by using a financial calculator or MS excel spreadsheet. Accordingly, you must show the values of all relevant time valu of money variables If D1 = $1.50 g (which is constant) = 6.5%, Po = $56, what is the stock's expected capital gains yield for the coming year?arrow_forwardFind the standard deviation for a security that has three one-year returns of -1%,8% , and 16%, respectively .arrow_forwardBond valuation related problems should be solved by using a financial calculator or MS excel spreadsheet. Accordingly, you must show the values of all relevant time valu of money variables If D1 = $1.25, g(which is constant) = 4.7%, and Po= $26.00 what is the stocks expected dividend yield for the coming year?arrow_forward
arrow_back_ios
SEE MORE QUESTIONS
arrow_forward_ios
Recommended textbooks for you
 Intermediate Financial Management (MindTap Course...FinanceISBN:9781337395083Author:Eugene F. Brigham, Phillip R. DavesPublisher:Cengage Learning
Intermediate Financial Management (MindTap Course...
Finance
ISBN:9781337395083
Author:Eugene F. Brigham, Phillip R. Daves
Publisher:Cengage Learning
Bond Valuation - A Quick Review; Author: Pat Obi;https://www.youtube.com/watch?v=xDWTPmqcWW4;License: Standard Youtube License