Materials for Civil and Construction Engineers (4th Edition)
4th Edition
ISBN: 9780134320533
Author: Michael S. Mamlouk, John P. Zaniewski
Publisher: PEARSON
expand_more
expand_more
format_list_bulleted
Concept explainers
Videos
Textbook Question
thumb_up100%
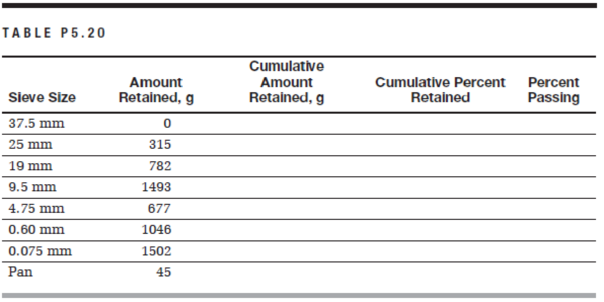
Chapter 5, Problem 5.20QP
Calculate the sieve analysis shown in Table P5.20, and plot on a 0.45 power gradation chart. What is the maximum size? What is the nominal maximum size?
Expert Solution & Answer
Want to see the full answer?
Check out a sample textbook solution
Students have asked these similar questions
A sieve analysis test was performed on a sample of coarse aggregate and produced the results in Tablea. Calculate the percent passing through each sieve.b. What is the maximum size?c. What is the nominal maximum size?d. Plot the percent passing versus sieve size on a semilog gradation chart.e. Plot the percent passing versus sieve size on a 0.45 gradation chart.f. Referring to Table (ASTM C33), what is the closest size number anddoes it meet the gradation for that standard size?
Complete the table and show complete computations. Draw the aggregate gradation chart. Calculate the fineness modulus for fine aggregate.
A sieve analysis test was performed on a sample of fine aggregate and produced the results in Table below.
Calculate the percent passing through each sieve.
What is the maximum size?
What is the nominal maximum size?
What is the Fineness Modulus?
Plot the percent passing versus sieve size on a semi-log gradation size. (You can use Excel sheets or you can draw on a semi-log attached to page 3 of this assignment)
Sieve size (mm)
Amount retained (g)
Cumulative amount retained (g)
Cumulative percentage retained
Percent passing
12.5
0
9.5
21
4.75
104
2.36
79
1.18
78
0.6
51
0.30
78
0.15
82
0.075
39
pan
5
Chapter 5 Solutions
Materials for Civil and Construction Engineers (4th Edition)
Ch. 5 - Prob. 5.1QPCh. 5 - Discuss five different desirable characteristics...Ch. 5 - Discuss five different desirable characteristics...Ch. 5 - The shape and surface texture of aggregate...Ch. 5 - Define the following terms: a. Saturated...Ch. 5 - Three samples of fine aggregate have the...Ch. 5 - A sample of wet aggregate weighed 297.2 N. After...Ch. 5 - 46.5 kg (102.3 lb) of fine aggregate is mixed with...Ch. 5 - Samples of coarse aggregate from a stockpile are...Ch. 5 - Base course aggregate has a target dry density of...
Ch. 5 - Calculate the percent voids between aggregate...Ch. 5 - Calculate the percent voids between aggregate...Ch. 5 - Coarse aggregate is placed in a rigid bucket and...Ch. 5 - The following laboratory tests are performed on...Ch. 5 - Students in the materials lab performed the...Ch. 5 - The specific gravity and absorption test (ASTM...Ch. 5 - Prob. 5.18QPCh. 5 - Calculate the sieve analysis shown in Table P5.19...Ch. 5 - Calculate the sieve analysis shown in Table P5.20,...Ch. 5 - A sieve analysis test was performed on a sample of...Ch. 5 - A sieve analysis test was performed on a sample of...Ch. 5 - Draw a graph to show the cumulative percent...Ch. 5 - Referring to Table 5.6, plot the specification...Ch. 5 - Referring to the aggregate gradations A, B, and C...Ch. 5 - Table P5.26 shows the grain size distributions of...Ch. 5 - Table P5.27 shows the grain size distributions of...Ch. 5 - Three aggregates are to be mixed together in the...Ch. 5 - Table P5.29 shows the grain size distribution for...Ch. 5 - Laboratory specific gravity and absorption tests...Ch. 5 - Table P5.31 shows the grain size distribution for...Ch. 5 - Prob. 5.32QPCh. 5 - Laboratory specific gravity and absorption tests...Ch. 5 - Prob. 5.34QPCh. 5 - Define the fineness modulus of aggregate. What is...Ch. 5 - Calculate the fineness modulus of aggregate A in...Ch. 5 - Calculate the fineness modulus of aggregate B in...Ch. 5 - A portland cement concrete mix requires mixing...Ch. 5 - Discuss the effect of the amount of material...Ch. 5 - Aggregates from three sources having the...Ch. 5 - Aggregates from three sources having the...Ch. 5 - A contractor is considering using three stockpiles...Ch. 5 - Prob. 5.43QPCh. 5 - What are the typical deleterious substances in...Ch. 5 - Review ASTM D75 and summarize the following: a....
Additional Engineering Textbook Solutions
Find more solutions based on key concepts
A 3 ft square footing carries a sustained load of 10 k. It is placed on the surface of a 30 ft thick saturated ...
Foundation Design: Principles and Practices (3rd Edition)
What production method for steel shapes is specified by the following organizations? AISI (American Iron and St...
Structural Steel Design (6th Edition)
5.11 What error results on a 200-ft sight with a level if the rod reading is 6.307 ft but the top of the
7-ft r...
Elementary Surveying: An Introduction To Geomatics (15th Edition)
1.2 Explain the difference between geodetic and plane
surveys,
Elementary Surveying (14th Edition)
11-1. Determine the moments at A,B, and C, then draw
the moment diagram for the beam. The moment of ine...
Structural Analysis (10th Edition)
Knowledge Booster


Learn more about
Need a deep-dive on the concept behind this application? Look no further. Learn more about this topic, civil-engineering and related others by exploring similar questions and additional content below.Similar questions
- A sieve analysis test was performed on a sample of coarse aggregate and pro- duced the results in Table P5.22. a. Calculate the percent passing through each sieve. b. What is the maximum size? c. What is the nominal maximum size? d. Plot the percent passing versus sieve size on a semilog gradation chart. e. Plot the percent passing versus sieve size on a 0.45 gradation chart (Figure A.25). f. Referring to Table 5.5 (ASTM C33), what is the closest size number and does it meet the gradation for that standard size? TABLE P5.22 Sieve Size, mm Amount Retained, g 75.0 50.0 37.5 1678 25.0 7212 19.0 5443 12.5 6124 9.5 12111 4.75 4581 Pan 590arrow_forwardFind the percent finer of each sieve.arrow_forwardCalculate the sieve analysis shown in Table, and plot on a 0.45 power gradation chart. What is the maximum size? What is the nominal maximum size?arrow_forward
- 10. A sample of coarse aggregate weighs 1072 g when oven- dried, 1091 g when saturated surface-dried, and 667.6 g when submerged. Calculate the bulk specific gravity, apparent specific gravity, and absorption.arrow_forward4. A sample of fine aggregate weighs 501.2 g when SSD and 491.6 g when OD. The flask weighs 540.6 g when filled with water and 843.1 g when filled with the aggregate sample and water. Calculate the bulk specific gravity, apparent specific gravity, and percent absorption.arrow_forwardSieve analysisarrow_forward
- 5.17 Calculate the sieve analysis of the following aggregate and plot on a semilog gradation paper. What is the maximum size? What is the nominal maximum size? Sieve Size 25 mm (1 in.) 9.5 mm (3/8 in.) 4.75 mm (No. 4) 2.00 mm (No. 10) 0.425 mm (No. 40) 0.075 mm (No.200) Pan Amount Cumulative Amount Cumulative Percent Retained, g Retained, g 0 47.1 239.4 176.5 92.7 73.5 9.6 Retained Percent Passingarrow_forwardCalculate the fineness modulus.arrow_forwardCalculate the fineness modulus of this fine aggregate sample. Report your answer to the nearest 1 decimal place (tens). Sieve Size, Retained Mass, % Retained Cumulative % % Passing mm (US) 12.5 (1/2") 9.5 (3/8") 4.75 (#4) 2.36 (#8) 1.18 (#16) 0.600 (#30) 0.300 (#50) 0.150 (#100) 0.075 (#200) Grams on Sieves retained on seives 3.0 0.36 0.36 99.64 10.0 1.22 1.58 98.42 30.0 3.65 5.22 94.78 55.0 6.68 11.91 88.09 230.0 27.95 39.85 60.15 175.0 21.26 61.12 38.88 140.0 17.01 78.13 21.87 120.0 14.58 92.71 7.29 40.0 4.86 97.57 2.43 Pan 20.0 2.43 100.00 0.00 Total: 823.0arrow_forward
- A small amount of resin weighing 4.56g occupies a height of a 10-ml graduated cylinder equivalent to one ml. One mL of water was added and the level was read at 1.7 mL. Estimate the porosity of the resin.arrow_forwardReferring to the aggregate gradations A, B, and C in Figure P5.26, answer the following questions: a. What is the maximum size of each gradation? b. What is the nominal maximum size of each gradation? c. Classify each gradation as dense, open, or gap indicating the reason for each classification. 100 A 80- 60 40 0.075 0.30 1.18 2.36 4.75 9.5 12.5 19.0 25.0 0.15 0.60 Sieve sizes (mm) FIGURE P5.26 Percent passing 20arrow_forwardPls write the complete solution cleanly.arrow_forward
arrow_back_ios
SEE MORE QUESTIONS
arrow_forward_ios
Recommended textbooks for you

 Structural Analysis (10th Edition)Civil EngineeringISBN:9780134610672Author:Russell C. HibbelerPublisher:PEARSON
 Principles of Foundation Engineering (MindTap Cou...Civil EngineeringISBN:9781337705028Author:Braja M. Das, Nagaratnam SivakuganPublisher:Cengage Learning
 Fundamentals of Structural AnalysisCivil EngineeringISBN:9780073398006Author:Kenneth M. Leet Emeritus, Chia-Ming Uang, Joel LanningPublisher:McGraw-Hill Education
 Traffic and Highway EngineeringCivil EngineeringISBN:9781305156241Author:Garber, Nicholas J.Publisher:Cengage Learning
Structural Analysis (10th Edition)
Civil Engineering
ISBN:9780134610672
Author:Russell C. Hibbeler
Publisher:PEARSON
Principles of Foundation Engineering (MindTap Cou...
Civil Engineering
ISBN:9781337705028
Author:Braja M. Das, Nagaratnam Sivakugan
Publisher:Cengage Learning
Fundamentals of Structural Analysis
Civil Engineering
ISBN:9780073398006
Author:Kenneth M. Leet Emeritus, Chia-Ming Uang, Joel Lanning
Publisher:McGraw-Hill Education
Traffic and Highway Engineering
Civil Engineering
ISBN:9781305156241
Author:Garber, Nicholas J.
Publisher:Cengage Learning
What Is A Construction Takeoff? | Are They Still Necessary In Quantity Surveying?; Author: Metroun Quantity Surveying;https://www.youtube.com/watch?v=uTWoDPtcOjg;License: Standard Youtube License