Intermediate Accounting: Reporting and Analysis
2nd Edition
ISBN: 9781285453828
Author: James M. Wahlen, Jefferson P. Jones, Donald Pagach
Publisher: Cengage Learning
expand_more
expand_more
format_list_bulleted
Videos
Textbook Question
Chapter 5, Problem 20E
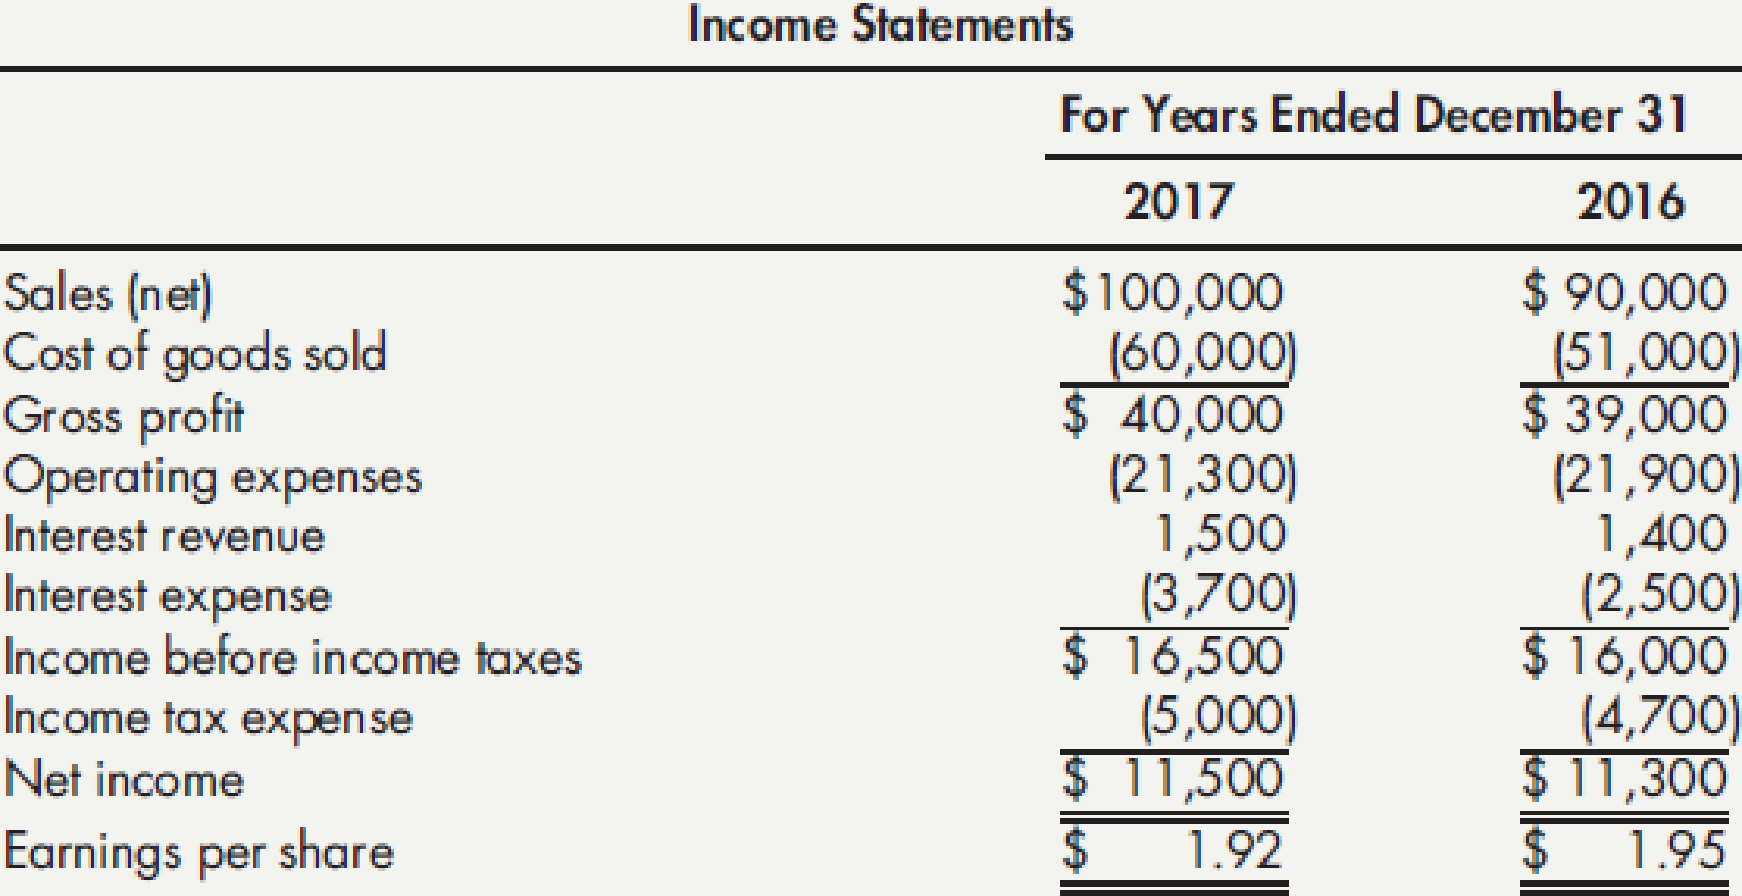
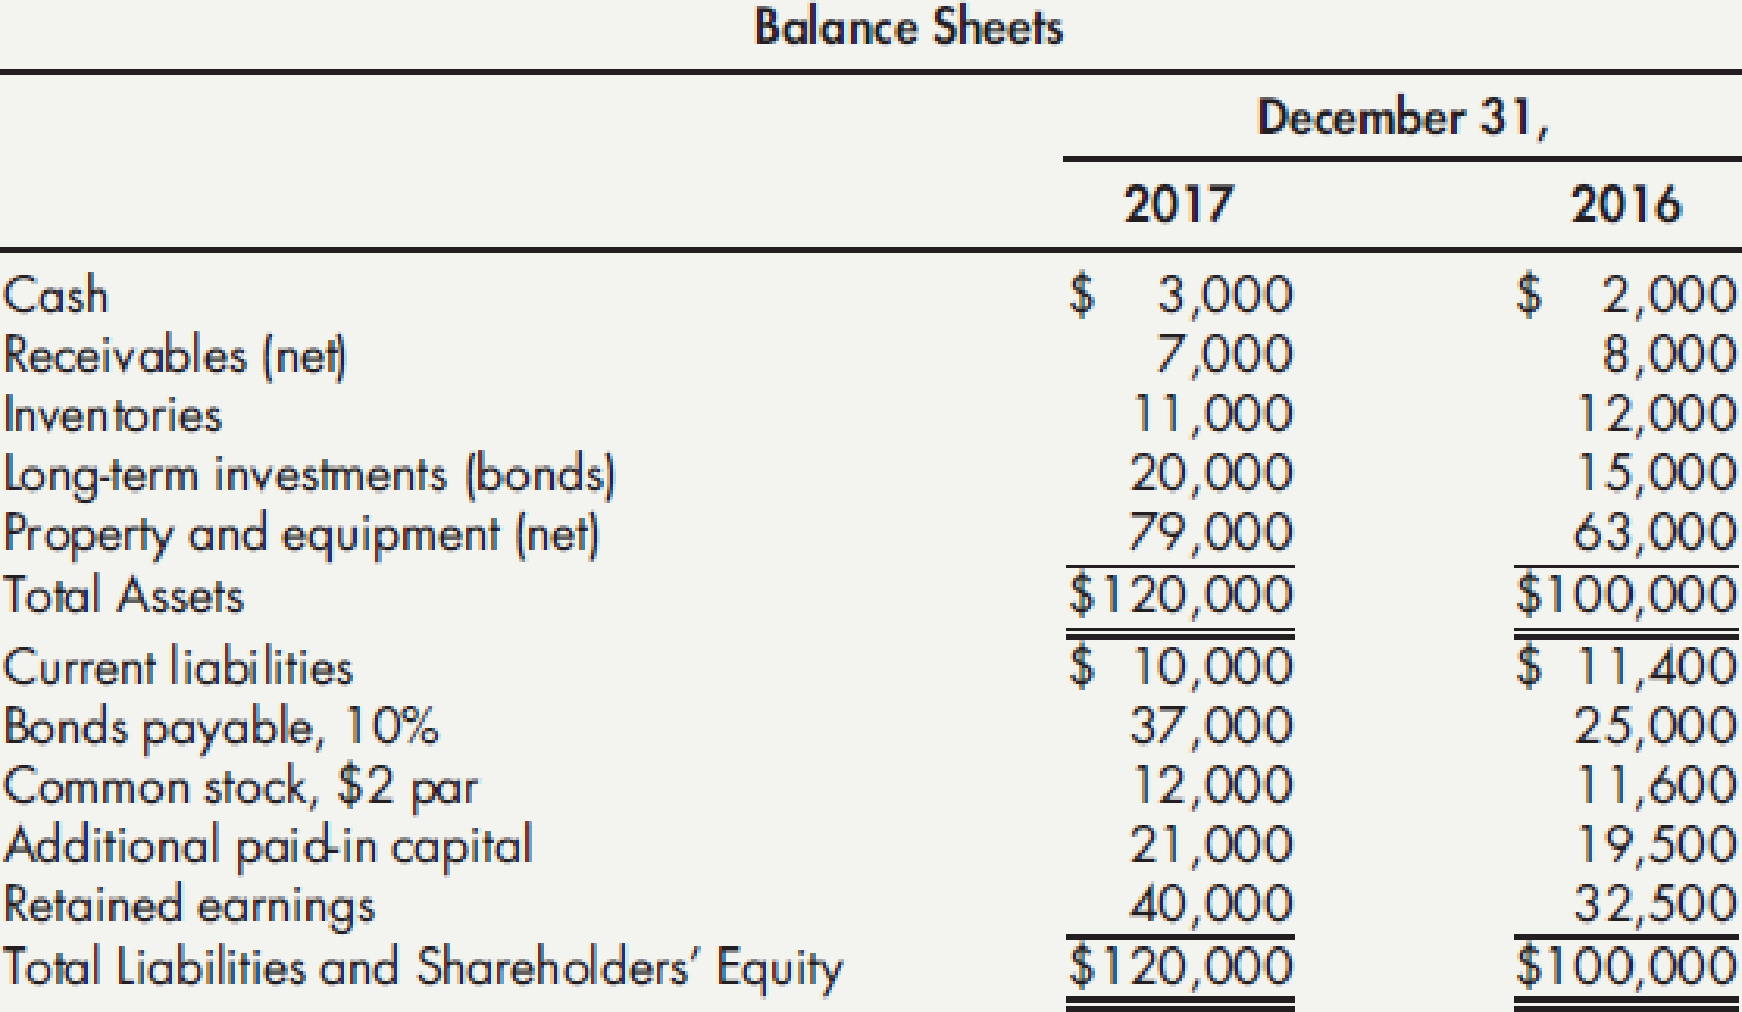
Common-Size Analyses Meagley Company presents the following condensed income statement and balance sheet information for 2016 and 2017:
Required:
Next Level Prepare Meagley’s common-size income statements and balance sheets for 2017 and 2016. What trends do your analyses reveal in Meagley’s operations and financial position?
Expert Solution & Answer
Want to see the full answer?
Check out a sample textbook solution
Students have asked these similar questions
Meagley Company presents the following condensed income statement and balance sheet information for 2020 and 2019: Next Level Prepare Meagley’s common-size income statements and balance sheets for 2020 and 2019. What trends do you analyses reveal in Meagley's operations and financial position?
A company’s comparative statements are given below. Please conduct the following analyses
(hint: use of a spreadsheet is recommended for ease of computation):a. Horizontal analysis (trend analysis) on the income statement
b. Vertical analysis (common size financial statement analysis) on the income statement
c. Calculate the three profitability ratios for the year 2017 and show how ROE can be derived from the DuPont formula for this company.
d. What do the analyses tell you about the company’s financial performance?
A company’s comparative statements are given below. Please conduct the following analyses:
c. Calculate the three profitability ratios for year 2017 and show how ROE can be derived from the DuPont formula for this company.
d. What do the analyses tell you about the company’s financial performance?
Chapter 5 Solutions
Intermediate Accounting: Reporting and Analysis
Ch. 5 - In general, how does the income statement help...Ch. 5 - Prob. 2GICh. 5 - Define income under the capital maintenance...Ch. 5 - Prob. 4GICh. 5 - What is net income?Ch. 5 - What three things must a company determine to...Ch. 5 - Prob. 7GICh. 5 - Prob. 8GICh. 5 - Prob. 9GICh. 5 - Give an example and explanation for each of the...
Ch. 5 - Define expenses. What do expenses measure?Ch. 5 - Prob. 12GICh. 5 - Define gains and losses. Give examples of three...Ch. 5 - Prob. 14GICh. 5 - What items are included in a companys income from...Ch. 5 - How are unusual or infrequent gains or losses...Ch. 5 - What is interperiod tax allocation?Ch. 5 - Prob. 18GICh. 5 - Prob. 19GICh. 5 - Prob. 20GICh. 5 - Prob. 21GICh. 5 - Prob. 22GICh. 5 - Prob. 23GICh. 5 - Prob. 24GICh. 5 - Prob. 25GICh. 5 - Prob. 26GICh. 5 - Prob. 27GICh. 5 - Prob. 28GICh. 5 - Prob. 29GICh. 5 - Prob. 30GICh. 5 - Prob. 31GICh. 5 - Prob. 32GICh. 5 - What is the rate of return on common equity? What...Ch. 5 - Prob. 34GICh. 5 - Prob. 35GICh. 5 - Which of the following is expensed under the...Ch. 5 - The following information is available for Cooke...Ch. 5 - The following information is available for Wagner...Ch. 5 - Prob. 4MCCh. 5 - A loss from the sale of a component of a business...Ch. 5 - In a statement of cash flows, receipts from sales...Ch. 5 - Brandt Corporation had sales revenue of 500,000...Ch. 5 - Refer to RE5-1. Prepare a single-step income...Ch. 5 - Shaquille Corporation began the current year with...Ch. 5 - Dorno Corporation incurred expenses during the...Ch. 5 - Niler Corporation reported the following after-tax...Ch. 5 - Jordan Corporation reported retained earnings of...Ch. 5 - Prob. 7RECh. 5 - Prob. 8RECh. 5 - Amelias Bookstore reported net income of 62,000...Ch. 5 - Prob. 10RECh. 5 - Prob. 1ECh. 5 - Prob. 2ECh. 5 - Prob. 3ECh. 5 - Cost of Goods Sold and Income Statement Schuch...Ch. 5 - Prob. 5ECh. 5 - Prob. 6ECh. 5 - Prob. 7ECh. 5 - Prob. 8ECh. 5 - Prob. 9ECh. 5 - Prob. 10ECh. 5 - Prob. 11ECh. 5 - Prob. 12ECh. 5 - Prob. 13ECh. 5 - Prob. 14ECh. 5 - Prob. 15ECh. 5 - Prob. 16ECh. 5 - Prob. 17ECh. 5 - Classifications Where would each of the following...Ch. 5 - Prob. 19ECh. 5 - Common-Size Analyses Meagley Company presents the...Ch. 5 - Prob. 21ECh. 5 - Prob. 22ECh. 5 - Prob. 23ECh. 5 - Prob. 24ECh. 5 - Prob. 25ECh. 5 - Prob. 26ECh. 5 - Prob. 1PCh. 5 - Prob. 2PCh. 5 - Prob. 3PCh. 5 - Prob. 4PCh. 5 - Financial Statement Violations of U.S. GAAP The...Ch. 5 - Rox Corporations multiple-step income statement...Ch. 5 - Prob. 7PCh. 5 - Prob. 8PCh. 5 - Prob. 9PCh. 5 - The following is an alphabetical list of accounts...Ch. 5 - Financial Statement Deficiencies The following is...Ch. 5 - Prob. 12PCh. 5 - Prob. 13PCh. 5 - Prob. 14PCh. 5 - Prob. 15PCh. 5 - Prob. 16PCh. 5 - Prob. 17PCh. 5 - Prob. 18PCh. 5 - Prob. 19PCh. 5 - Prob. 20PCh. 5 - Prob. 21PCh. 5 - Prob. 22PCh. 5 - Prob. 23PCh. 5 - Prob. 1CCh. 5 - Prob. 2CCh. 5 - Prob. 3CCh. 5 - Prob. 4CCh. 5 - Nonrecurring Items Lynn Company sells a component...Ch. 5 - Prob. 6CCh. 5 - Accrual Accounting GAAP requires the use of...Ch. 5 - Prob. 8CCh. 5 - Prob. 9CCh. 5 - Prob. 10CCh. 5 - Prob. 12C
Knowledge Booster


Learn more about
Need a deep-dive on the concept behind this application? Look no further. Learn more about this topic, accounting and related others by exploring similar questions and additional content below.Similar questions
- The comparative financial statements of Global Technology are as follows: Review the worksheet RATIOA that follows these requirements. You have been asked to perform a ratio analysis of this company for 2012.arrow_forwardVII. Direction: Compute and interpret. The following comparative financial statements are provided by Avatar Industries. You were asked to compute the different financial ratios and provide your interpretations with regards to profitability, efficiency, liquidity and solvency of the company. Use the Answer Sheet template below to input your answer and solution. AVATAR INDUSTRIES AVATAR INDUSTRIES Comparative Statement of Financial Position For the years 2019 and 2018 Comparative Income Statement For the years 2019 and 2018 2019 2018 2019 2018 ASSETS Current Assets: Sales P200,000 P210,000 Cash & Cash Equivalent P65,000 P70,000 Sales Returns and Allowances 40,000 25,000 Accounts Receivable 40,000 35,000 Net Sales 160,000 185,000 Marketable Secuities 40,000 35,000 Cost of Goods Sold 100,000 115,625 Inventory 100,000 80,000 Gross Profit 60,000 69,375 Total Current Assets 220,000 200,000 160,000 P445,000 P380,000 245,000 Operating Expenses: Fixed Assets Selling Expenses 22,000 25,000 Total…arrow_forwardVII. Direction: Compute and interpret. The following comparative financial statements are provided by Avatar Industries. You were asked to compute the different financial ratios and provide your interpretations with regards to profitability, efficiency, liquidity and solvency of the company. Use the Answer Sheet template below to input your answer and solution. AVATAR INDUSTRIES AVATAR INDUSTRIES Comparative Statement of Financial Position For the years 2019 and 2018 Comparative Income Statement For the years 2019 and 2018 2019 2018 2019 2018 ASSETS Current Assets: Sales P200,000 P210,000 Cash & Cash Equivalent P65,000 P70,000 Sales Returns and Allowances 40,000 25,000 Accounts Receivable 40,000 35,000 Net Sales 160,000 185,000 Marketable Securities 40,000 35,000 Cost of Goods Sold 100,000 115,625 Inventory 100,000 80,000 Gross Profit 60,000 69,375 Total Current Assets 245,000 220,000 Operating Expenses: Fixed Assets 200,000 160,000 Selling Expenses 22,000 25,000 Total Assets P445,000…arrow_forward
- You are provided with the Income Statement and the Balance Sheet of HTS software, Inc. for 2011.Required: (a) Calculate the ratios stated in the table below for HTS Software, Inc. for 2011 (b) Analyze the current financial position for the company from a time series and cross section viewpoint. (c) Break your analysis into an evaluation of the firm’s liquidity, activity, debt, profitability and market ratios.arrow_forwardAnalyze the financial statements of the company to you in terms of: 1. Debt Management Ratio * TIE Ratio or Time Interest Earned Ratio 2. Asset Management Ratio *Inventory Turnover Ratio *Fixed Asset Turnover Ratio *Total Asset Turnover Ratio 2020 Analysis BUT also compare with 2018 - 2019. Show solution on computaion.arrow_forwardInstruction: (Vertical Analysis) Present an interpretation and conclusions about the result of "Riel Corporation Comparative Income Statements For the years Ended December 31, 2015 & 2014" computations and analysis. *refer to the pic*arrow_forward
- You are provided with the Income Statement and the Balance Sheet of HTS software, Inc. for 2011. Required: (a) Calculate the ratios stated in the table below for HTS Software, Inc. for 2011 (b) Analyze the current financial position for the company from a time series and cross section viewpoint. (c) Break your analysis into an evaluation of the firm’s liquidity, activity, debt, profitability and market ratios. Historical and Industry Average Ratios HTS Software , Inc. Ratio 2010 2011 Industry2011 Current Ratio 2.6 — 2.7 Quick Ratio 1.8 — 1.75 Inventory Turnover 4.5 — 4.7 Average Collection Period 40days — 42 days Total Asset Turnover 1.2 — 1 Debt Ratio 20% — 21% Times Interest Earned 9 — 8.9 Gross Profit Margin 43% — 44% Operating Profit Margin 30% — 32% Net Profit Margin 20% — 21% Return on total assets 12% — 13% Return on Equity Price/Earnings Ratio…arrow_forwardYou are provided with the Income Statement and the Balance Sheet of HTS software, Inc. for 2011. Required: (b) Analyze the current financial position for the company from a time series and cross section viewpoint. (c) Break your analysis into an evaluation of the firm’s liquidity, activity, debt, profitability and market ratios. Historical and Industry Average Ratios HTS Software , Inc. Ratio 2010 2011 Industry2011 Current Ratio 2.6 2.08 2.7 Quick Ratio 1.8 1.32 1.75 Inventory Turnover 4.5 6 4.7 Average Collection Period 40days 9.125 42 days Total Asset Turnover 1.2 1.69 1 Debt Ratio 20% 28.2% 21% Times Interest Earned 9 5.9% 8.9 Gross Profit Margin 43% 42.8% 44% Operating Profit Margin 30% 25.5% 32% Net Profit Margin 20% 17% 21% Return on total assets 12% 4.11% 13% Return on Equity Price/Earnings Ratio 15% 7.3 19% 4.4 16% 8…arrow_forwardAnalyze the financial statements of the company to you in terms of: 1. Profitability Ratio: *Operating Margin *Return on Total Assets *Return on Common Equity. *Return on Invested Capital *Basic Earnings Power Ratio2020 Analysis BUT also compare with 2018 - 2019. Show solution on computaion.arrow_forward
- Using the data for 2018 and the industry norms, compute the financial ratios that were discussed in this chapter (current ratio, return on assets, operating profit margin, total asset turnover, debt ratio, and return on equity).arrow_forwardEvaluation: Financial Statements Analysis and Interpretations Instructions: 1. Using the provided data below, prepare a Statement of Financial Position - Vertical Analysis. 2. Compute for the following financial ratios and provide interpretation for each item. a. Current Ratio b. Working Capital c. Debt-to-Equity Ratio d. Debt Ratio e. Asset Turnover Ratio 3. You may use any desired business name. 4. Use the space provided for your answer. Given: 2017 2016 P 358,950.00 P 184,560.00 P 365,450.00 P 450,355.00 P 252,260.00 P 653,550.00 P 300,000.00 P 800,000.00 P 943,105.00 P 65,000.00 P 277,145.00 P 68,505.00 P 285,000.00 P 235,000.00 P 345,650.00 P 745,000.00 P 150,000.00 P 700,000.00 P 800,000.00 85,000.00 Accounts Payable Accrued Expenses Accounts Receivable Cash Inventory Fixed Assets Marketable Securities Mortgage Payable Owner's Capital Prepaid Insurancearrow_forwardFinancial Statements Analysis and Interpretations Instructions: 1. Using the provided data below, prepare a Statement of Financial Position - Vertical Analysis. 2. Compute for the following financial ratios and provide interpretation for each item. a. Current Ratio b. Working Capital c. Debt-to-Equity Ratio d. Debt Ratio e. Asset Turnover Ratio 3. You may use any desired business name. 4. Use the space provided for your answer. Given: 2017 2016 P 358,950.00 P 184,560.00 P 365,450.00 P 450,355.00 P 252,260.00 P 653,550.00 P 300,000.00 P 600,000.00 P 943,105.00 P 65,000.00 P 277,145.00 P 68,505.00 P 285,000.00 P 235,000.00 P 345,650.00 P 745,000.00 P 150,000.00 P 700,000.00 P 800,000.00 Accounts Payable Accrued Expenses Accounts Receivable Cash Inventory Fixed Assets Marketable Securities Mortgage Payable Owner's Capital Prepaid Insurance 85,000.00arrow_forward
arrow_back_ios
SEE MORE QUESTIONS
arrow_forward_ios
Recommended textbooks for you
 Cornerstones of Financial AccountingAccountingISBN:9781337690881Author:Jay Rich, Jeff JonesPublisher:Cengage Learning
 Excel Applications for Accounting PrinciplesAccountingISBN:9781111581565Author:Gaylord N. SmithPublisher:Cengage Learning
Cornerstones of Financial Accounting
Accounting
ISBN:9781337690881
Author:Jay Rich, Jeff Jones
Publisher:Cengage Learning
Excel Applications for Accounting Principles
Accounting
ISBN:9781111581565
Author:Gaylord N. Smith
Publisher:Cengage Learning
How To Analyze an Income Statement; Author: Daniel Pronk;https://www.youtube.com/watch?v=uVHGgSXtQmE;License: Standard Youtube License