
Concept explainers
Videos
(a)
To explain how well does the regression line fit the data and also give numerical and graphical evidence to support the answer.
(a)
Explanation of Solution
Graphical:
The residuals are all centered about zero and the regression line fits the data well.
Numerical:
The square of the
Thus, we then know that
(b)
To compare the temperature predictions for the least square line and this formula.
(b)
Explanation of Solution
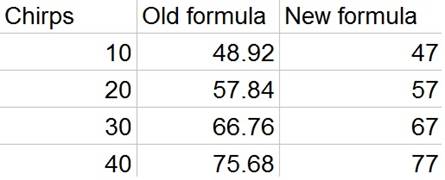
We note that this new formula gives values that are relatively close to the old formula. The first two values are underestimated and the other two values are overestimated.
Chapter 4 Solutions
Statistics Through Applications
Additional Math Textbook Solutions
Elementary Statistics
Statistical Reasoning for Everyday Life (5th Edition)
Introductory Statistics
Essentials of Statistics, Books a la Carte Edition (5th Edition)
STATS:DATA+MODELS-W/DVD
An Introduction to Mathematical Statistics and Its Applications (6th Edition)


 MATLAB: An Introduction with ApplicationsStatisticsISBN:9781119256830Author:Amos GilatPublisher:John Wiley & Sons Inc
 Probability and Statistics for Engineering and th...StatisticsISBN:9781305251809Author:Jay L. DevorePublisher:Cengage Learning
 Statistics for The Behavioral Sciences (MindTap C...StatisticsISBN:9781305504912Author:Frederick J Gravetter, Larry B. WallnauPublisher:Cengage Learning
 Elementary Statistics: Picturing the World (7th E...StatisticsISBN:9780134683416Author:Ron Larson, Betsy FarberPublisher:PEARSON
 The Basic Practice of StatisticsStatisticsISBN:9781319042578Author:David S. Moore, William I. Notz, Michael A. FlignerPublisher:W. H. Freeman
 Introduction to the Practice of StatisticsStatisticsISBN:9781319013387Author:David S. Moore, George P. McCabe, Bruce A. CraigPublisher:W. H. Freeman