
Concept explainers
Videos
(a)
To construct a
(a)
Explanation of Solution
The scatterplot that shows the relationship between the city and highway mileage for a minicompact cars using city mileage as the explanatory variable is as follows,
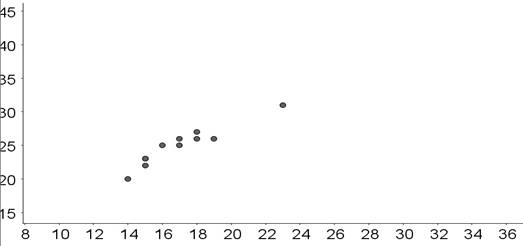
The horizontal axis is city mileage and the vertical axis is highway mileage.
(b)
To construct a scatterplot that shows the relationship between the city and highway mileage for a two -seatercars.
(b)
Explanation of Solution
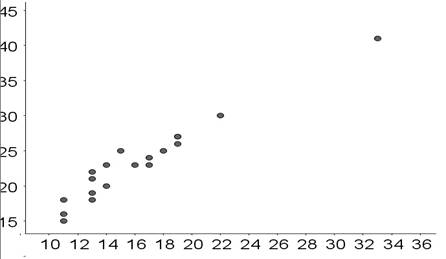
The scatter plot that shows the relationship between the city and highway mileage for a two -seater cars is as follows:
(c)
To describe the scatterplots for both and is there any relationship similar to the both types of the cars and what is the most important difference in the both types.
(c)
Explanation of Solution
By looking at the scatterplot of the both types of cars we can see that the no relationship in the both. And the most important difference is that the graph of the two-seater cars is linear while the graph of minicompact cars has a curve in the data.
Chapter 4 Solutions
Statistics Through Applications
Additional Math Textbook Solutions
Elementary Statistics: Picturing the World (7th Edition)
Essentials of Statistics (6th Edition)
Introductory Statistics
Intro Stats, Books a la Carte Edition (5th Edition)
Elementary Statistics (13th Edition)
Elementary Statistics Using Excel (6th Edition)


 MATLAB: An Introduction with ApplicationsStatisticsISBN:9781119256830Author:Amos GilatPublisher:John Wiley & Sons Inc
 Probability and Statistics for Engineering and th...StatisticsISBN:9781305251809Author:Jay L. DevorePublisher:Cengage Learning
 Statistics for The Behavioral Sciences (MindTap C...StatisticsISBN:9781305504912Author:Frederick J Gravetter, Larry B. WallnauPublisher:Cengage Learning
 Elementary Statistics: Picturing the World (7th E...StatisticsISBN:9780134683416Author:Ron Larson, Betsy FarberPublisher:PEARSON
 The Basic Practice of StatisticsStatisticsISBN:9781319042578Author:David S. Moore, William I. Notz, Michael A. FlignerPublisher:W. H. Freeman
 Introduction to the Practice of StatisticsStatisticsISBN:9781319013387Author:David S. Moore, George P. McCabe, Bruce A. CraigPublisher:W. H. Freeman