
Concept explainers
Videos
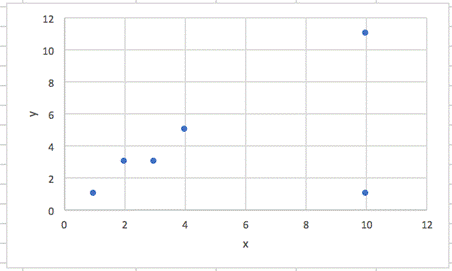
(a)
To construct the
(a)
Explanation of Solution
The scatterplot for the data is:
(b)
To show that the
(b)
Explanation of Solution

Calculating standardized value of
(c)
To find out the feature of the data that is responsible for reducing the correlation to this value despite a strong straight line association between
(c)
Explanation of Solution
The fifth data point disrupts the strong correlation because of this the data that is responsible for reducing the correlation to this value despite a strong straight line association between
Chapter 4 Solutions
Statistics Through Applications
Additional Math Textbook Solutions
Introductory Statistics
Elementary Statistics: Picturing the World (6th Edition)
Intro Stats, Books a la Carte Edition (5th Edition)
Elementary Statistics
Elementary Statistics: Picturing the World (7th Edition)


 MATLAB: An Introduction with ApplicationsStatisticsISBN:9781119256830Author:Amos GilatPublisher:John Wiley & Sons Inc
 Probability and Statistics for Engineering and th...StatisticsISBN:9781305251809Author:Jay L. DevorePublisher:Cengage Learning
 Statistics for The Behavioral Sciences (MindTap C...StatisticsISBN:9781305504912Author:Frederick J Gravetter, Larry B. WallnauPublisher:Cengage Learning
 Elementary Statistics: Picturing the World (7th E...StatisticsISBN:9780134683416Author:Ron Larson, Betsy FarberPublisher:PEARSON
 The Basic Practice of StatisticsStatisticsISBN:9781319042578Author:David S. Moore, William I. Notz, Michael A. FlignerPublisher:W. H. Freeman
 Introduction to the Practice of StatisticsStatisticsISBN:9781319013387Author:David S. Moore, George P. McCabe, Bruce A. CraigPublisher:W. H. Freeman