
Concept explainers
Videos
(a)
To construct a
(a)
Explanation of Solution
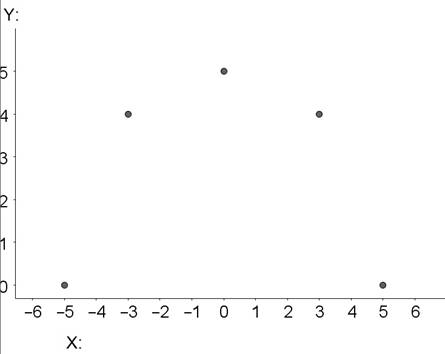
The scatterplot of the data is as follows:
(b)
To show that the
(b)
Explanation of Solution
The mean of
Now to calculate standard deviation of
Consider the following table-
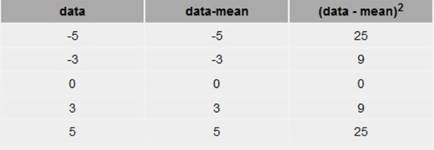
Then the sum of the numbers in the last column to get;
Calculate
The mean of
The standard deviation of
Consider the table-
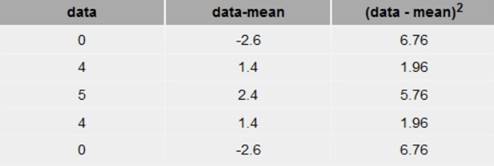
Now we calculate the sum of numbers in the last column to get;
Calculate
The correlation is determined with the formula:-
Now, we will find the value of
Now computing in the correlation formula we get,
Thus, the correlation is zero.
(c)
To explain that how correlation is zero as the scatterplot shows strong association between
(c)
Explanation of Solution
As the scatterplot shows strong association between
Chapter 4 Solutions
Statistics Through Applications
Additional Math Textbook Solutions
Elementary Statistics: Picturing the World (7th Edition)
STATS:DATA+MODELS-W/DVD
Elementary Statistics Using Excel (6th Edition)
Essentials of Statistics (6th Edition)


 MATLAB: An Introduction with ApplicationsStatisticsISBN:9781119256830Author:Amos GilatPublisher:John Wiley & Sons Inc
 Probability and Statistics for Engineering and th...StatisticsISBN:9781305251809Author:Jay L. DevorePublisher:Cengage Learning
 Statistics for The Behavioral Sciences (MindTap C...StatisticsISBN:9781305504912Author:Frederick J Gravetter, Larry B. WallnauPublisher:Cengage Learning
 Elementary Statistics: Picturing the World (7th E...StatisticsISBN:9780134683416Author:Ron Larson, Betsy FarberPublisher:PEARSON
 The Basic Practice of StatisticsStatisticsISBN:9781319042578Author:David S. Moore, William I. Notz, Michael A. FlignerPublisher:W. H. Freeman
 Introduction to the Practice of StatisticsStatisticsISBN:9781319013387Author:David S. Moore, George P. McCabe, Bruce A. CraigPublisher:W. H. Freeman