
Videos
A round aluminum alloy bar with a 0.25-in. diameter and a 1-in. gauge length was tested in tension to fracture according to ASTM E-8 method. The load and deformation data were as shown in Table P4.8.
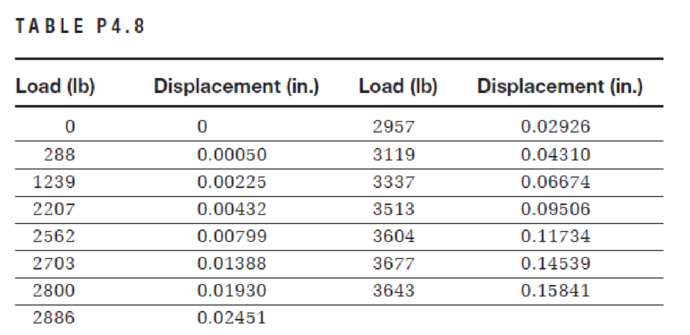
Using a spreadsheet program, obtain the following:
a. A plot of the stress–strain relationship. Label the axes and show units.
b. A plot of the linear portion of the stress–strain relationship. Determine modulus of elasticity using the best fit approach.
c. Proportional limit.
d. Yield stress at an offset strain of 0.002 in/in.
e. Initial tangent modulus.
f. If the specimen is loaded to 3200 lb only and then unloaded, what is the permanent change in gauge length?
g. When the applied load was 1239 lb, the diameter was measured as 0.249814 in. Determine Poisson’s ratio.
Want to see the full answer?
Check out a sample textbook solution
Chapter 4 Solutions
Materials for Civil and Construction Engineers (4th Edition)


- The data in Table 1.5.3 were obtained from a tensile test of a metal specimen with a rectangular cross section of 0.2011in.2 in area and a gage length (the length over which the elongation is measured) of 2.000 inches. The specimen was not loaded to failure. a. Generate a table of stress and strain values. b. Plot these values and draw a best-fit line to obtain a stress-strain curve. c. Determine the modulus of elasticity from the slope of the linear portion of the curve. d. Estimate the value of the proportional limit. e. Use the 0.2 offset method to determine the yield stress.arrow_forwardA tensile test was performed on a metal specimen having a circular cross section with a diameter of 1 2 inch. The gage length (the length over which the elongation is measured) is 2 inches. For a load 13.5 kips, the elongation was 4.6610 3 inches. If the load is assumed to be within the linear elastic rang: of the material, determine the modulus of elasticity.arrow_forwardA tensile test was performed on a metal specimen having a circular cross section with a diameter 0. 510 inch. For each increment of load applied, the strain was directly determined by means of a strain gage attached to the specimen. The results are, shown in Table: 1.5.1. a. Prepare a table of stress and strain. b. Plot these data to obtain a stress-strain curve. Do not connect the data points; draw a best-fit straight line through them. c. Determine the modulus of elasticity as the slope of the best-fit line.arrow_forward
- An ASTM A615 grade 60 number 10 rebar with a gauge length of 8 in. was subjected to tension to fracture according to ASTM E-8 method. The load and deformation data were as shown in Table .Using a spreadsheet program, obtain the following:a. A plot of the stress–strain relationship. Label the axes and show units.b. A plot of the linear portion of the stress–strain relationship. Determine modulus of elasticity using the best-fit approach.c. Proportional limit.arrow_forwardA 19-mm reinforcing steel bar and a gauge length of 75 mm was subjected to ten- sion, with the results shown in Table P3.27. Using a computer spreadsheet pro- gram, plot the stress-strain relationship. From the graph, determine the Young's modulus of the steel and the deformation corresponding to a 150-kN load. TABLE P3.27 Load, kN Deformation, mm 54 0.084 163 0.168 284 0.336 330 1.428 366 3.360arrow_forwardA 32-mm rebar with a gauge length of 200 mm was subjected to tension to fracture according to ASTM E-8 method. The load and deformation data were as shown in Table P3.33. Using a spreadsheet program obtain the following: a. A plot of the stress-strain relationship. Label the axes and show units. b. A plot of the linear portion of the stress-strain relationship. Determine modulus of elasticity using the best-fit approach. c. Proportional limit. d. Yield stress. e. Ultimate strength. f. If the rebar is loaded to 390 kN only and then unloaded, what is the permanent change in length? TABLE P3.3 3 Load (kN) Displacement (mm) Load (kN) Displacement (mm) 472.9 8.4 62.2 0.1 487.1 9.7 188.9 0.2 496.4 11.1 329.8 0.4 505.7 12.4 383.4 1.7 512.8 13.7 426.0 4.0 522.6 15.3 447.3 5.9 532.4 18.5 462.5 7.2 525.9 22.4arrow_forward
- A tensile test specimen of stainless steel alloy having a diameter of 0.495 in. and a gage length of 2.00 in. was tested to fracture. Stress and strain data obtained during the test are shown. Determine the modulus of elasticity. 120 Upper scale 90 60 Lower scale 30 0.040 0.004 0.060 0.006 0.120 0.012 0.020 0.100 0.010 0.0 0.080 0.008 0.0 0.002 Strain (in./in.) Stress (ksi)arrow_forwardThe following data were obtained from the tensile test of Aluminum alloy. The initial diameter of test specimen was 0.505 inch and gauge length was 2.0 inch. Plot the stress strain diagram and determine (a) Proportional Limit (b) Modulus of Elasticity (c) Yield Stress at 0.2% offset (d) Ultimate Stress and (e) Nominal Rupture Stress. st 0.8 015 Load (Ib) Elongation (in.) Load (Ib) Elongation (in.) 14 000 0.020 2310 0.0022 14400 0.025 4640 0.0044 14 500 0.060 6950 0.0066 14 600 0.080 9 290 0.0088 14 800 0.100 11 600 13 000 0.0110 14 600 0.120 0.0150 13 600 Fracturearrow_forwardA round steel bar with a diameter of 12.5 mm and a gauge length of 50 mm was subjected to tension to rupture following ASTM E-8 test procedure. The load and deformation data were as shown in Table P3.30. Using a spreadsheet program obtain the following: a. A plot of the stress-strain relationship. Label the axes and show units. b. A plot of the linear portion of the stress-strain relationship. Determine modulus of elasticity using the best fit approach. c. Proportional limit. d. Yield stress. e. Ultimate strength. f. When the applied load was 18 kN, the diameter was measured as 12.7 mm Determine Poisson's ratio. g. After the rod was broken, the two parts were put together and the diameter at the neck was measured as 10.6 mm What is the true stress value at fracture? Is the true stress at fracture larger or smaller than the engineering stress at fracture? Why? h. Do you expect the true strain at fracture to be larger or smaller than the engineering strain at fracture? Why? TABLE P3.30…arrow_forward
- Q2c) Listed in the table below is the tensile stress-strain data for different grades of steels. Utilizing the data given answer the three queries given below. Material Yield Tensile Strain at Fracture Elastic StrengthStrengthFractureStrengthModulus (MPa) (MPa) (MPa) (GPa) A 410 1440 0.63 265 410 В 200 220 0.40 105 250 C 815 950 0.25 500 610 D 800 650 0.14 720 210 E Fractures before yielding 650 550 1) Which will experience the greatest percent reduction in area? Why? 2) Which is the strongest? Why? 3) Which is the stiffest? Why?arrow_forwardQuestion No.1 : A 32-mm rebar with a gauge length of 200 mm was subjected to tension to fracture according to ASTM E-8 method. The load and deformation data were as shown in table below. Using calculations and diagram obtain the following: a. A plot of the stress-strain relationship. Label the axes and show units. b. A plot of the linear portion of the stress-strain relationship. Determine modulus of elasticity using the best-fit approach. c. Proportional limit. d. Yield stress. e. Ultimate strength. f. Modulus of resilience and toughness. g. If the rebar is loaded to 390 kN only and then unloaded, what is the permanent change in length? Load (kN) Displacement (mm) Load (kN) Displacement (mm) 472.9 8.4 62.2 0.1 487.1 9.7 188.9 0.2 496.4 11.1 329.8 0.4 505.7 12.4 383.4 1.7 512.8 13.7 426.0 4.0 522.6 15.3 447.3 5.9 532.4 18.5 462.5 7.2 525.9 22.4arrow_forwardThe following data were obtained from the tensile test of Aluminum alloy. The initial diameter of testspecimen was 0.505 inch and gauge length was 2.0 inch. Plot the stress strain diagram and determine(a) Proportional Limit (b) Modulus of Elasticity (c) Yield Stress at 0.2% offset (d) Ultimate Stress and(e) Nominal Rupture Stress.arrow_forward
 Steel Design (Activate Learning with these NEW ti...Civil EngineeringISBN:9781337094740Author:Segui, William T.Publisher:Cengage Learning
 Materials Science And Engineering PropertiesCivil EngineeringISBN:9781111988609Author:Charles GilmorePublisher:Cengage Learning