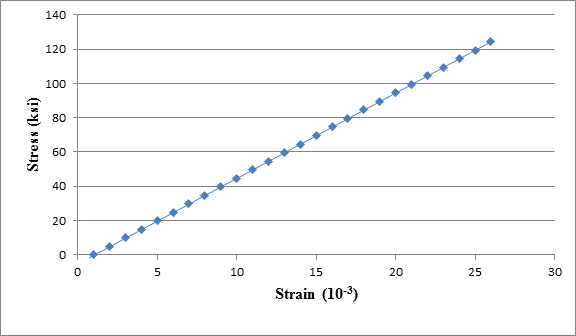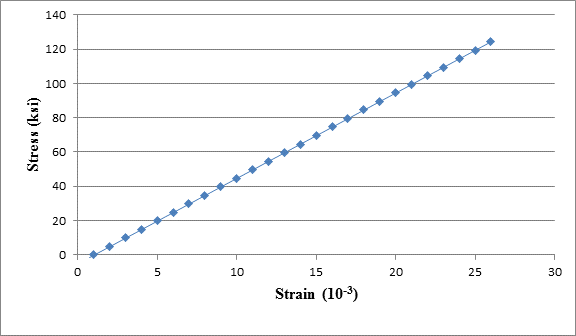
The data in Table 1.5.3 were obtained from a tensile test of a metal specimen with a rectangular cross section of
a. Generate a table of stress and strain values.
b. Plot these values and draw a best-fit line to obtain a stress-strain curve.
c. Determine the modulus of elasticity from the slope of the linear portion of the curve.
d. Estimate the value of the proportional limit.
e. Use the


Trending nowThis is a popular solution!

Chapter 1 Solutions
Steel Design (Activate Learning with these NEW titles from Engineering!)
Additional Engineering Textbook Solutions
Mechanics of Materials (10th Edition)
Java How to Program, Early Objects (11th Edition) (Deitel: How to Program)
Elementary Surveying: An Introduction To Geomatics (15th Edition)
Database Concepts (8th Edition)
Electric Circuits. (11th Edition)
Degarmo's Materials And Processes In Manufacturing
- P.3.4 A mercury U-tube manometer is used to measure the pressure drop across an orifice in pipe. If the liquid that flowing through the orifice is brine of sp.gr. 1.26 and upstream pressure is 2 psig and the downstream pressure is (10 in Hg) vacuum, find the reading of manometer. Ans. R=394 mm Hgarrow_forwardProject management questionarrow_forwardQ5/B with Explantion plsarrow_forward
- project management question Q5/Barrow_forwardProblem 1: Given: In a given floor system, a 5-in concrete slab supported by T-beams of 24-ft spans, supporting 354 psf live load. The T-beams are spaced 2x4 ft on center, and bw (width of the beam web) = 15 inches. Total T-beam height is 25 inches. f'c = 4,000psi, fy = 60,000psi. Design the T-beam. Show all steps. Sketch your Design. Problem 2: Given: A 25"x25" column is subject to a factored axial load of Pu=1,200 kips, and factored design moment of Mu-354 kips-ft. f'c 4,000psi, fy = 60,000psi. Determine the required steel ratio (p) and ties. Sketch the design. 2.0 0.08 INTERACTION DIAGRAM R4-60.9 fc-4 ksi 1.8 1,- 60 ksi 0.07 Y=0.9 16 1.6 0.06 Kmax 0.05 1.4 f/f, = 0 0.04 00 K₁ = P₁/f'c Ag 1.2 12 0.03 0.25 1.0 10 0.02 0.01 0.8 0.6 0.4 €,= 0.0035 0.2 €,= 0.0050 0.0 h yh 0.50 0.75 1.0. 0.00 0.05 0.10 0.15 0.20 0.25 0.30 0.35 0.40 0.45 0.50 R₁ = P₁e/f'Agharrow_forwardGiven: In a given floor system, a 5-in concrete slab supported by T-beams of 24-ft spans, supporting 354 psf live load. The T-beams are spaced 2x4 ft on center, and bw (width of the beam web) = 15 inches. Total T-beam height is 25 inches. f'c = 4,000psi, fy = 60,000psi. Design the T-beam. Show all steps. Sketch your Design.arrow_forward
- Problem 2: Given: A 25"x25" column is subject to a factored axial load of Pu=1,200 kips, and factored design moment of Mu-354 kips-ft. f'c 4,000psi, fy = 60,000psi. Determine the required steel ratio (p) and ties. Sketch the design. 2.0 P=0.08 INTERACTION DIAGRAM R4-60.9 fc-4 ksi 1.8 1,- 60 ksi 0.07 7=0.9 1.6 16 0.06 Kmax 0.05 1.4 f/f, = 0 0.04 90 K₁ = P₁/f'Ag 1.2 0.03 0.25 0.02 1.0 0.01 0.8 0.6 0.4 €= 0.0035 0.2 €,= 0.0050 0.0 h yh 0.50 0.75 1.0. 0.00 0.05 0.10 0.15 0.20 0.25 0.30 0.35 0.40 0.45 0.50 R₁ = P₁e/f'Aharrow_forwardGiven: A 25"x25" column is subject to a factored axial load of Pu=1,200 kips, and factored design moment of Mu=354 kips-ft. f'c 4,000psi, fy = 60,000psi. Determine the required steel ratio () and ties. Sketch the design.arrow_forwardSee Figure (1) below. A 14 in. wide and 2 in. thick plate subject to tensile loading has staggered holes as shown. Compute An and Ae. P 2.00 3.00 4.00 3.00 2.00 ΕΙ T A B C F G D S = 2.50 3/4" bolts in 13/16" holes 14x12 PL Parrow_forward
 Steel Design (Activate Learning with these NEW ti...Civil EngineeringISBN:9781337094740Author:Segui, William T.Publisher:Cengage Learning
 Materials Science And Engineering PropertiesCivil EngineeringISBN:9781111988609Author:Charles GilmorePublisher:Cengage Learning

