
Concept explainers
Videos
Funding for the Arts The U.S. federal government spends between $6 and $7 per person on the arts and culture each year. The following chart shows the data for 2002–2010, together with the regression line:
Federal funding for the arts
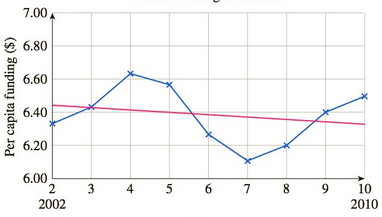
Year
a. Over the period
(A) less than
(B) greater than
(C) approximately equal to the rate predicted by the regression line.
b. Over the period
(A) less than
(B) greater than
(C) approximately equal to the rate predicted by the regression line.
c. Over the period
(A) less than
(B) greater than
(C) approximately equal to the rate predicted by the regression line.
d. Estimate, to one significant digit, the average rate of change of per capita federal government funding for the arts over the period
Want to see the full answer?
Check out a sample textbook solution
Chapter 3 Solutions
Applied Calculus
Additional Math Textbook Solutions
Calculus Early Transcendentals, Binder Ready Version
Calculus and Its Applications (11th Edition)
Calculus, Single Variable: Early Transcendentals (3rd Edition)
Calculus 2012 Student Edition (by Finney/Demana/Waits/Kennedy)
University Calculus
University Calculus: Early Transcendentals (4th Edition)


- Find the equation of the regression line for the following data set. x 1 2 3 y 0 3 4arrow_forwardLife Expectancy The following table shows the average life expectancy, in years, of a child born in the given year42 Life expectancy 2005 77.6 2007 78.1 2009 78.5 2011 78.7 2013 78.8 a. Find the equation of the regression line, and explain the meaning of its slope. b. Plot the data points and the regression line. c. Explain in practical terms the meaning of the slope of the regression line. d. Based on the trend of the regression line, what do you predict as the life expectancy of a child born in 2019? e. Based on the trend of the regression line, what do you predict as the life expectancy of a child born in 1580?2300arrow_forward-Using the data in Table 6–11, answer the following: What is the slope? What is the intercept? Write the regression equation. Calculate a regression forecast for month 25.arrow_forward
- The U.S. Postal Service is attempting to reduce the number of complaints made by the public against its workers. To facilitate this task, a staff analyst for the service regresses the number of complaints lodged against an employee last year on the hourly wage of the employee for the year. The analyst ran a simple linear regression in SPSS. The results are shown below. What proportion of variation in the number of complaints can be explained by hourly wages? From the results shown above, write the regression equation If wages were increased by $1.00, what is the expected effect on the number of complaints received per employee?arrow_forwardIf the correlation coefficient is zero, the slope of a linear regression line will be a. positive b. negative c. positive or negativearrow_forwardAccording to human capital theory, a person’s earning is linked to her level of education – there is a relationship between workers income and years of education. Using data from the Labour Force Survey, a researcher found the following regression results for earnings on intercept, years of education, experience, and experience squared: Earnings = 5.24 + 0.035 educ + 0.165 exper – 0.003 exper2 (2.45) (0.012) (0.031) (0.001) Construct a 95% confidence interval for the effect of years of education on earnings ? 2. Consider an individual with 8 years of experience. What would you expect to be the return to two (2) additional years of experience (the effect on earnings)? 3. According to economic theory,…arrow_forward
- The value of a sports franchise is directly related to the amount of revenue that a franchise can generate. The accompanying data table gives the value and the annual revenue for 15 major sport teams. Suppose you want to develop a simple linear regression model to predict franchise value based on annual revenue generated.arrow_forwardWrite a detail note on REGRESSION?arrow_forwardThe demand for electric power supplied by Eskom over the period 2003 to 2009 is shown in the table below in megawatts. Nike wants you to forecast demand for 2010 by using the simple linear regression method and also draw a graph Year Time Demand 2003 1 74 2004 2 79 2005 3 80 2006 4 90 2007 5 105 2008 6 142 2009 7 122arrow_forward
- An individual's adjusted gross income is the amount of income that is subject to federal income tax. The following table shows the total adjusted gross income (AGI), in trillions of dollars, reported to the IRS in the given year. 2009 2010 2011 2012 9.1 Year AGI (trillions) 7.6 8.1 8.6 (a) Show that the data are linear. , the difference from 2010 to 2011 is and the difference from 2011 to 2012 is The difference in the total AGI (in trillions) from 2009 to 2010 is Because these values are all the same v , the function is linear. (b) Let t denote the time in years since 2009, and let A denote the total adjusted gross income. Find a linear model for A as a function of t. A(t) = (c) Identify the slope of the linear model you found in part (b). trillion dollars per year Explain its meaning in practical terms. O The slope is the initial amount, in trillion of dollars, of the AGI. O The slope is the number of months it will take the AGI to increase by one trillion dollars. O The slope is the…arrow_forwardA magazine publishes restaurant ratings for various locations around the world. The magazine rates the restaurants for food, decor, service, and the cost per person. Develop a regression model to predict the cost per person, based on a variable that represents the sum of the three ratings. The magazine has compiled the accompanying table of this summated ratings variable and the cost per person for 25 restaurants in a major city. Complete parts (a) through (e) below. Click the icon to view the table of summated ratings and cost per person. ..... a. Construct a scatter plot. Choose the correct graph below. A. Ов. С. D. ACost ($) 90- ACost ($) 90- ACost ($) 90- ACost ($) 90- 0- 0- 90 90 90 90 Rating Rating Rating Rating b. Assuming a linear relationship, use the least-squares method to compute the regression coefficients b, and b,. bo = and b, (Round to two decimal places as needed.) c. Interpret the meaning of the Y-intercept, bo, and the slope, b,. Choose the correct answer below. O A.…arrow_forwardA magazine publishes restaurant ratings for various locations around the world. The magazine rates the restaurants for food, decor, service, and the cost per person. Develop a regression model to predict the cost per person, based on a variable that represents the sum of the three ratings. The magazine has compiled the accompanying table of this summated ratings variable and the cost per person for 25 restaurants in a major city. Complete parts (a) through (e) below. Click the icon to view the table of summated ratings and cost per person. a. Construct a scatter plot. Choose the correct graph below. O A. Ов. OC. OD. ACost ($) 90- Q A Cost ($) 904 A Cost ($) 90- ACost ($) 90- 0- 0- 0- 0- 90 Rating 90 Rating 90 90 Rating Rating Summated ratings and cost per person b. Assuming a linear relationship, use the least-squares method to compute the regression coefficients bo and b,. bo =D and b, =O (Round to two decimal places as needed.) Summated Rating Cost ($ per person)|9 c. Interpret the…arrow_forward
 Functions and Change: A Modeling Approach to Coll...AlgebraISBN:9781337111348Author:Bruce Crauder, Benny Evans, Alan NoellPublisher:Cengage Learning
 Calculus For The Life SciencesCalculusISBN:9780321964038Author:GREENWELL, Raymond N., RITCHEY, Nathan P., Lial, Margaret L.Publisher:Pearson Addison Wesley,
 Glencoe Algebra 1, Student Edition, 9780079039897...AlgebraISBN:9780079039897Author:CarterPublisher:McGraw Hill