
Concept explainers
Videos
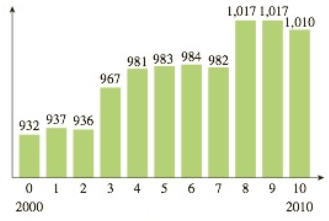
College Basketball: Men The following chart shows the number of NCAA men’s college basketball teams in the United States during the period 2000–2010:
Men’s basketball teams
Year (t)
a. On average, how fast was the number of men’s college basketball teams growing over the 4-year period beginning in 2002?
b. By inspecting the chart, determine whether the 3-year average rates of change increased or decreased beginning in 2005. [HINT: See Example 2.]

Trending nowThis is a popular solution!

Chapter 3 Solutions
Applied Calculus
Additional Math Textbook Solutions
Calculus 2012 Student Edition (by Finney/Demana/Waits/Kennedy)
Precalculus (10th Edition)
Finite Mathematics and Calculus with Applications (10th Edition)
Glencoe Math Accelerated, Student Edition
Precalculus
Precalculus Enhanced with Graphing Utilities (7th Edition)


- The revenue for Google for the years 2010–2014 is shown in the following table (Wallstreet Journal, August 2014). Deflate the revenue in dollars based on the CPI (1982–1984base period). Comment on the company’s revenue in deflated dollars. Year Revenue ($ billions) CPI2010 29.3 218.12011 37.9 224.92012 50.2 229.62013 59.8 233.02014 66.7 236.7arrow_forwardBecause of high tuition costs at state and private universities, enrollments atcommunity colleges have increased dramatically in recent years. The following data show theenrollment (in thousands) for Jefferson Community College from 2001–2009:Year Period (t) Enrollment (1000s)2001 1 6.52002 2 8.12003 3 8.42004 4 10.22005 5 12.52006 6 13.32007 7 13.72008 8 17.22009 9 18.1Compute F10: the Forecast for 2010. Compute Pearson’s Correlation Coefficient Use the Method of Least Squares to obtain the Best-Fit-Line for this data. Use the line to compute the forecast.arrow_forwardThe file P02_26.xlsx lists sales (in millions of dollars) of Dell Computer during the period 1987–1997 (where year 1 corresponds to 1987). Year Sales 1 69 2 159 3 258 4 389 5 546 6 890 7 2014 8 2873 9 3475 10 5296 11 7759 a. Fit a power and an exponential trend curve to these data. Which fits the data better? b. Use your part a answer to predict 1999 sales for Dell. c. Use your part a answer to describe how the sales of Dell have grown from year to year.arrow_forward
- The figure below shows timber production in particular months from 2000 to 2005. Which of the following months of the year seems to have the lowest timber production? (a) January (b) April (c) July (d) Octoberarrow_forwardQ. Table provided gives data on gross domestic product (GDP) for the United States for the years 1959–2005. a. Plot the GDP data in current and constant (i.e., 2000) dollars against time. b. Letting Y denote GDP and X time (measured chronologically starting with 1 for 1959, 2 for 1960, through 47 for 2005), see if the following model fits the GDP data: Yt = β1 + β2 Xt + ut Estimate this model for both current and constant-dollar GDP. c. How would you interpret β2? d. If there is a difference between β2 estimated for current-dollar GDP and that estimated for constant-dollar GDP, what explains the difference? e. From your results what can you say about the nature of inflation in the United States over the sample period?arrow_forwardUsing the data in Table 6–11, calculate a 3-month moving average forecast for month 12.arrow_forward
- The following chart shows "living wage" jobs in Rochester per 1000 working age adults over a 5 year period. Year 2016 2017 2018 2019 2020 Jobs 675 730 775 805 820 What is the average rate of change in the number of living wage jobs from 2016 to 2018? Jobs/Year What is the average rate of change in the number of living wage jobs from 2018 to 2020? Jobs/Yeararrow_forwardQ1. The table provided gives data on indexes of output per hour (X) and real compensation per hour (Y) for the business and nonfarm business sectors of the U.S. economy for 1960–2005. The base year of the indexes is 1992 = 100 and the indexes are seasonally adjusted. a. Plot Y against X for the two sectors separately. b. What is the economic theory behind the relationship between the two variables? Does the scattergram support the theory? c. Estimate the OLS regression of Y on X. Note: on the table ( 1. Output refers to real gross domestic product in the sector. 2. Wages and salaries of employees plus employers’ contributions for social insurance and private benefit plans. 3. Hourly compensation divided by the consumer price index for all urban consumers for recent quarters.) Thank you!arrow_forwardNielsen tracks the amount of time that people spend consuming media content across different platforms (digital, audio, television) in the United States. Nielsen has found that traditional television viewing habits vary based on the age of the consumer as an increasing number of people consume media through streaming devices.† The following data represent the weekly traditional TV viewing hours in 2016 for a sample of 14 people aged 18–34 and 12 people aged 35–49. (Round your answers to two decimal places.) Viewers aged 18–34 24.2 21.0 17.8 19.6 23.4 19.1 14.6 27.1 19.2 18.3 22.9 23.4 17.3 20.5 Viewers aged 35–49 24.9 34.9 35.8 31.9 35.4 29.9 30.9 36.7 36.2 33.8 29.5 30.8 (a) Compute the mean and median weekly hours of traditional TV viewed by those aged 18–34.arrow_forward
- Using the data in Table 6–11, calculate a 3-month moving average forecastfor month 12.arrow_forwardThe financial aid office at Burke University produced an internal report on the number of students receiving scholarships. Students receiving scholarships Year Students 2017 18 2018 35 2019 28 2020 30 2021 18 According to the table, what was the rate of change between 2017 and 2018? students per yeararrow_forwardThe following chart shows "living wage" jobs in Rochester per 1000 working age adults over a 5 year period. Year 2016 2017 2018 2019 2020 Jobs 650 695 735 770 800 What is the average rate of change in the number of living wage jobs from 2016 to 2018? Jobs/Year What is the average rate of change in the number of living wage jobs from 2018 to 2020? Jobs/Year > Next Questionarrow_forward
 Calculus: Early TranscendentalsCalculusISBN:9781285741550Author:James StewartPublisher:Cengage Learning
 Thomas' Calculus (14th Edition)CalculusISBN:9780134438986Author:Joel R. Hass, Christopher E. Heil, Maurice D. WeirPublisher:PEARSON
 Calculus: Early Transcendentals (3rd Edition)CalculusISBN:9780134763644Author:William L. Briggs, Lyle Cochran, Bernard Gillett, Eric SchulzPublisher:PEARSON
 Calculus: Early TranscendentalsCalculusISBN:9781319050740Author:Jon Rogawski, Colin Adams, Robert FranzosaPublisher:W. H. Freeman
 Calculus: Early Transcendental FunctionsCalculusISBN:9781337552516Author:Ron Larson, Bruce H. EdwardsPublisher:Cengage Learning