
(a)
Interpretation:
Retention time for cinnamaldehyde should be determined using Figure b.
Concept introduction:
The retention time of a substance can be determined using the chromatogram. The distance between the starting position (0) and the peak of the interested substance. From the x-axis of the chromatogram, retention time of the interested substance can be determined.
Answer to Problem 27.30QAP
Retention time = 19 min
Explanation of Solution
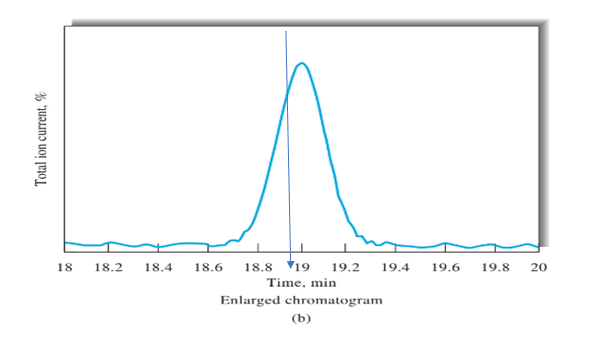
Figure b peak is obtained on the time of 19 mins, as shown using blue arrow. Therefore, retention time for cinnamaldehyde is 19 mins.
(b)
Interpretation:
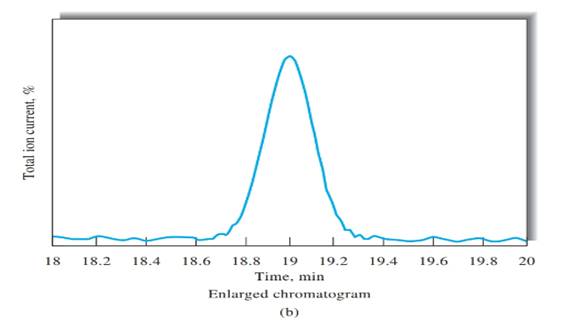
Number of theoretical plates should be calculated using Figure b.
Concept introduction:
Answer to Problem 27.30QAP
N= 36,100
Explanation of Solution
Peak width, (W) should be determined first, in order to calculate the number of theoretical plates. Peak width can be determined using Figure b, indicated in black arrow.
(c)
Interpretation:
Plate height should be calculated using the information in part a and b.
Concept introduction:
Plate height can be calculated using the following equation.
Answer to Problem 27.30QAP
Plate height = 0.83 mm
Explanation of Solution
Given information:
L= 30 cm
(d)
Interpretation:
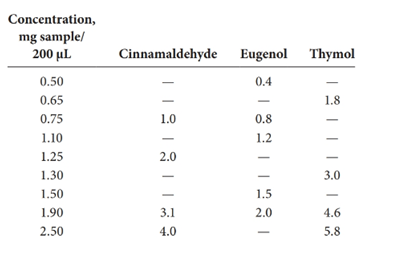
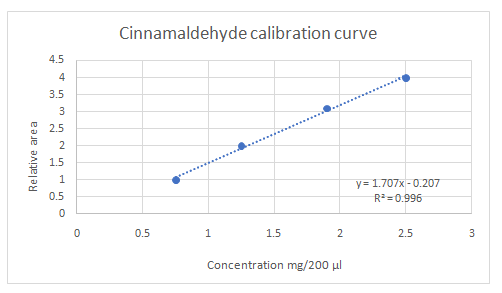
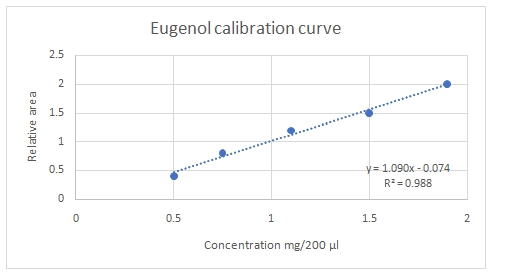
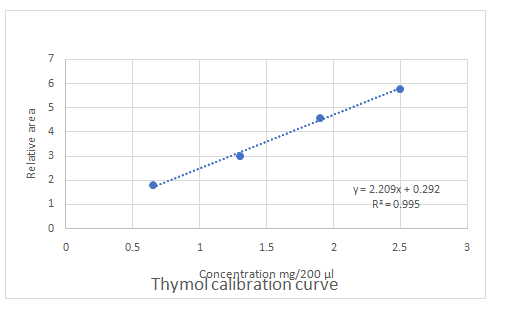
Calibration curves should be plotted for cinnamaldehyde, eugenol, and thymol. The R2 values for each compound also should be determined.
Concept introduction:
Standard addition method is an analytical method used in quantitative analysis of unknown samples. Calibration curves can be plotted, concentration vs relative peak area. That plot can be used to determine the unknown sample concentration.
Answer to Problem 27.30QAP
Explanation of Solution
Given information:
(e)
Interpretation:
Sensitivity levels of the calibration curves should be determined, as highest and lowest.
Concept introduction:
Linear regression R2 can be used to determine the linearity between two variables, with regard to this question the sensitivity of the calibration curve can be determined by the R2 value.
Answer to Problem 27.30QAP
Highest calibration curve sensitivity= Cinnamaldehyde
Lowest calibration curve sensitivity= Eugenol
Explanation of Solution
Higher the linear regression, higher the sensitivity of calibration curve. Linear regression R2 can be used to determine the linearity between two variables. Statistically, higher linear regression represents higher linearity/fitting of two variables to a linear equation.
Therefore, in this case cinnamaldehyde has the highest sensitivity, while eugenol has the lowest sensitivity.
(f)
Interpretation:
Concentrations of each component in the sample should be calculated. Then the standard deviation also should be calculated.
Concept introduction:
The equation obtained from the calibration curve in part d can be used in the calculation of concentrations of unknown samples.
Answer to Problem 27.30QAP
Standard deviations of:
Cinnamaldehyde=1.130
Eugenol=0.564
Thymol= 1.523
Explanation of Solution
Given information:
Information provided in the question that is used to solve this particular category
Relative peak areas:
Cinnamaldehyde=2.6
Eugenol=0.9
Thymol=3.8
Detailed explanation/work out of the complete problem.
Standard deviations were calculated using Excel sheets.
(g)
Interpretation:
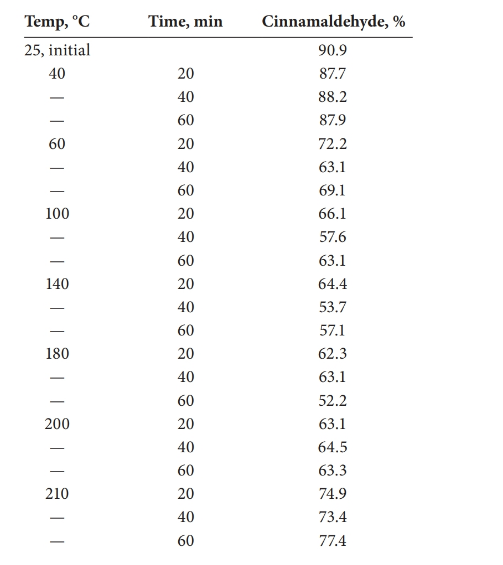
The statistical effect should be calculated for the decomposition of cinnamaldehyde with the temperature.
Concept introduction:
Analysis of variance (ANOVA) test can be done in order to determine whether there is a statistical effect on temperature for the decomposition of cinnamaldehyde.
Answer to Problem 27.30QAP
There is a statistical effect on the decomposition of cinnamaldehyde.
Explanation of Solution
Given information:
Detailed explanation/work out of the complete problem.
The test was carried out using Excel.
| Anova: Single Factor | ||||||
| SUMMARY | ||||||
| Groups | Count | Sum | Average | Variance | ||
| Column 1 | 7 | 930 | 132.8571 | 4623.81 | ||
| Column 2 | 7 | 490.7 | 70.1 | 82.59 | ||
| ANOVA | ||||||
| Source of Variation | SS | df | MS | F | P-value | F crit |
| Between Groups | 13784.61 | 1 | 13784.61 | 5.857814 | 0.0323 | 4.747225 |
| Within Groups | 28238.4 | 12 | 2353.2 | |||
| Total | 42023 | 13 | ||||
| Anova: Two-Factor Without Replication | ||||||
| SUMMARY | Count | Sum | Average | Variance | ||
| 20 | 7 | 490.7 | 70.1 | 82.59 | ||
| 40 | 7 | 463.6 | 66.22857 | 131.359 | ||
| 60 | 7 | 470.1 | 67.15714 | 149.1929 | ||
| 40 | 3 | 263.8 | 87.93333 | 0.063333 | ||
| 60 | 3 | 204.4 | 68.13333 | 21.40333 | ||
| 100 | 3 | 186.8 | 62.26667 | 18.58333 | ||
| 140 | 3 | 175.2 | 58.4 | 29.89 | ||
| 180 | 3 | 177.6 | 59.2 | 36.91 | ||
| 200 | 3 | 190.9 | 63.63333 | 0.573333 | ||
| 210 | 3 | 225.7 | 75.23333 | 4.083333 | ||
| ANOVA | ||||||
| Source of Variation | SS | df | MS | F | P-value | F crit |
| Rows | 57.19143 | 2 | 28.59571 | 2.06938 | 0.168992 | 3.885294 |
| Columns | 2013.03 | 6 | 335.5049 | 24.27942 | 4.75E-06 | 2.99612 |
| Error | 165.8219 | 12 | 13.81849 | |||
| Total | 2236.043 | 20 | ||||
(h)
Interpretation:
The test should be carried out to the hypothesis that, there is no effect of temperature or time on the decomposition of the sample.
Concept introduction:
Statistical test ANOVA should be carried out in order to check the hypothesis.
Answer to Problem 27.30QAP
Check the explanation part.
Explanation of Solution
| Anova: Two-Factor Without Replication | ||||||
| SUMMARY | Count | Sum | Average | Variance | ||
| 20 | 6 | 403 | 67.16667 | 26.83067 | ||
| 40 | 6 | 375.4 | 62.56667 | 44.99067 | ||
| 60 | 6 | 382.2 | 63.7 | 78.636 | ||
| 60 | 3 | 204.4 | 68.13333 | 21.40333 | ||
| 100 | 3 | 186.8 | 62.26667 | 18.58333 | ||
| 140 | 3 | 175.2 | 58.4 | 29.89 | ||
| 180 | 3 | 177.6 | 59.2 | 36.91 | ||
| 200 | 3 | 190.9 | 63.63333 | 0.573333 | ||
| 210 | 3 | 225.7 | 75.23333 | 4.083333 | ||
| ANOVA | ||||||
| Source of Variation | SS | df | MS | F | P-value | F crit |
| Rows | 68.92444 | 2 | 34.46222 | 2.238356 | 0.157272 | 4.102821 |
| Columns | 598.3244 | 5 | 119.6649 | 7.772354 | 0.003183 | 3.325835 |
| Error | 153.9622 | 10 | 15.39622 | |||
| Total | 821.2111 | 17 | ||||
Want to see more full solutions like this?
Chapter 27 Solutions
Principles of Instrumental Analysis

- A 35 year old male was taken to the hospital with excruciating pain in the lower abdominal area. It was discovered that this patient drank no more than half a glass of water each day over the past week, while drinking at least three cups of black tea on the same days. Additionally, the patient regularly eats very large quantities of spinach. Upon further analysis, it was determined that the presence of Calcium Iodideand Sodium Oxalate may have led to the pain that the patient was experiencing. Determine whether or not kidney stones could be the probable cause of the lower abdominal pain for this patient by answering the following questions (Be sure to show your work for all parts): Assume that Calcium Iodideand Sodium Oxalate are the starting substances (reactants) in the reaction: a. Write a balanced chemical equation describing the formation of kidney stones, using the information in the case study. b. State the names of the products that are produced from this reaction. c.…arrow_forwardA 35 year old male was taken to the hospital with excruciating pain in the lower abdominal area. It was discovered that this patient drank no more than half a glass of water each day over the past week, while drinking at least three cups of black tea on the same days. Additionally, the patient regularly eats very large quantities of spinach. Upon further analysis, it was determined that the presence of Calcium Iodideand Sodium Oxalate may have led to the pain that the patient was experiencing. Determine whether or not kidney stones could be the probable cause of the lower abdominal pain for this patient by answering the following questions (Be sure to show your work for all parts): Assume that Calcium Iodideand Sodium Oxalate are the starting substances (reactants) in the reaction: a. Write a balanced chemical equation describing the formation of kidney stones, using the information in the case study. b. State the names of the products that are produced from this reaction. c.…arrow_forwardA 35 year old male was taken to the hospital with excruciating pain in the lower abdominal area. It was discovered that this patient drank no more than half a glass of water each day over the past week, while drinking at least three cups of black tea on the same days. Additionally, the patient regularly eats very large quantities of spinach. Upon further analysis, it was determined that the presence of Calcium Iodideand Sodium Oxalate may have led to the pain that the patient was experiencing. Determine whether or not kidney stones could be the probable cause of the lower abdominal pain for this patient by answering the following questions (Be sure to show your work for all parts): Assume that Calcium Iodideand Sodium Oxalate are the starting substances (reactants) in the reaction: a. Write a balanced chemical equation describing the formation of kidney stones, using the information in the case study. b. State the names of the products that are produced from this reaction. c.…arrow_forward
- A 35 year old male was taken to the hospital with excruciating pain in the lower abdominal area. It was discovered that this patient drank no more than half a glass of water each day over the past week, while drinking at least three cups of black tea on the same days. Additionally, the patient regularly eats very large quantities of spinach. Upon further analysis, it was determined that the presence of Calcium Iodideand Sodium Oxalate may have led to the pain that the patient was experiencing. Determine whether or not kidney stones could be the probable cause of the lower abdominal pain for this patient by answering the following questions (Be sure to show your work for all parts): Assume that Calcium Iodideand Sodium Oxalate are the starting substances (reactants) in the reaction: a. Write a balanced chemical equation describing the formation of kidney stones, using the information in the case study. b. State the names of the products that are produced from this reaction. c.…arrow_forwardA 35 year old male was taken to the hospital with excruciating pain in the lower abdominal area. It was discovered that this patient drank no more than half a glass of water each day over the past week, while drinking at least three cups of black tea on the same days. Additionally, the patient regularly eats very large quantities of spinach. Upon further analysis, it was determined that the presence of Calcium Iodideand Sodium Oxalate may have led to the pain that the patient was experiencing. Determine whether or not kidney stones could be the probable cause of the lower abdominal pain for this patient by answering the following questions (Be sure to show your work for all parts):arrow_forwardSelective serotonin reuptake inhibitors (SSRIs) are commonly prescribed antidepressants. SSRIs block the reabsorption of the neurotransmitter serotonin in the brain. Changing the balance of serotonin helps brain cells send and receive chemical messages, which in turn boosts mood. Two SSRI medications are Faverin (fluvoxamine, C15H21F3N2O2 ) and Zoloft (sertraline, C17H17Cl2N ). Determine the molar masses of Faverin and Zoloftarrow_forward
- Given Epsom salt - https://fscimage.fishersci.com/msds/13510.htm Describe the adverse effects of the substance to newborns or child development during pregnancy. Mutagenic Slightly mutagenic Teratogenic Non-teratogenic Non-mutagenicarrow_forwardExplain the reactions involved in separation separation of benzoic acid from mixture contain 3 components 1.Benzoic acid (acidic nature pKa=4.17) 2.Naphthalene (neutral compound) 3.paraNitroaniline(basic compound pKa=12.99arrow_forwardTopic: Isolation of Crude Ovalbumin from Egg White by Ammonium Sulfate Precipitation (Salting Out) crude ovalbumin was isolated from egg whites of two medium-sized eggs. Egg whites contain about 88.5% water and about 10% proteins, from which ovalbumin is the major component. The eggs were cracked open, and the egg whites were separated carefully from the yolk. Stirring of the egg whites was done to break up the membrane. This was followed by filtration through cheesecloth, where a clear filtrate was obtained. About 40.0 mL of the filtered undiluted egg white was measured, and 0.10 mL of 1 M acetic acid was slowly added for every 1.0 mL of egg white with constant stirring. A turbid mixture with few amounts of white precipitate may be expected to form. These may be removed by filtering the mixture using a cheesecloth. After filtration, 30.0 mL of the filtrate was obtained, and the solution was brought from 0% to 40% saturation by adding the required amount of powdered ammonium sulfate,…arrow_forward
- 3. a) Briefly describe the advantage of using cardiac troponin I over cardiac troponin T in diagnosis of myocardial infarction (a heart attack). b) Enumerate five (05) features of an ideal tumour marker c) List five (05) components each for the following in a urine full report i. Macroscopic analysis of urine II. Microscopic analysis of urine 4. a) Briefly describe how the van den Burgh test is used in assessing serum bilirubin. b) List five (05) biochemical tests used in assessing renal /kidney function. c) Calculate the GFR based on the following biochemical data. 24-hour total urine volume = 1440 ml Serum creatinine concentration = 4 mg/dL == Urine creatinine concentration = 40mg/dL 3arrow_forwardh) i) j) Ph + НО OSI(CH3)3 Br PPH3 1) "BuLi /THF/rt / 1.5 h H CH3 homo /rt / 1 h 2) -Si(CH3)3 OCH3 TiCl4 CH₂Cl₂/-78°C / 15 min PPh3/1₂ (1 eq) imidazole / THE 0°C-itarrow_forwarddiacetylferrocene 550 .0 7.5 70 6.5 4.5A 4.0 3.5 3.0 chemical shift (ppm 6.0 5.5 5.0 2.5 2.0 1.5 1.0 0.5 0.0 diacetylferrocene -110 -90 7 of 7 210 200 190 180 17o 160 150 140 130 120 O 50 40 30 chemical shift (ppm) 201.18 7.26 CDC13 4.50 80.84 77.16 CDC13. -73.71 60'IL 6,18 2.34 - 27.75 8 R 8 8 ? 8 2arrow_forward
 Principles of Instrumental AnalysisChemistryISBN:9781305577213Author:Douglas A. Skoog, F. James Holler, Stanley R. CrouchPublisher:Cengage Learning
 Organic ChemistryChemistryISBN:9781305580350Author:William H. Brown, Brent L. Iverson, Eric Anslyn, Christopher S. FootePublisher:Cengage Learning