
Concept explainers
Videos
In an experiment to compare two different surgical procedures for hernia repair (“A Single-Blinded, Randomized Comparison of Laparoscopic Versus Open Hernia Repair in Children,” Pediatrics [2009]: 332-336), 89 children were assigned at random to one of the two surgical methods. The researchers relied on the random assignment of subjects to treatments to create comparable groups with respect to extraneous variables that they did not control. One such extraneous variable was age.
After random assignment to treatments, the researchers looked at the age distribution of the children in each of the two experimental groups (laparoscopic repair [LR] and open repair [OR]). The accompanying figure is similar to one in the paper.
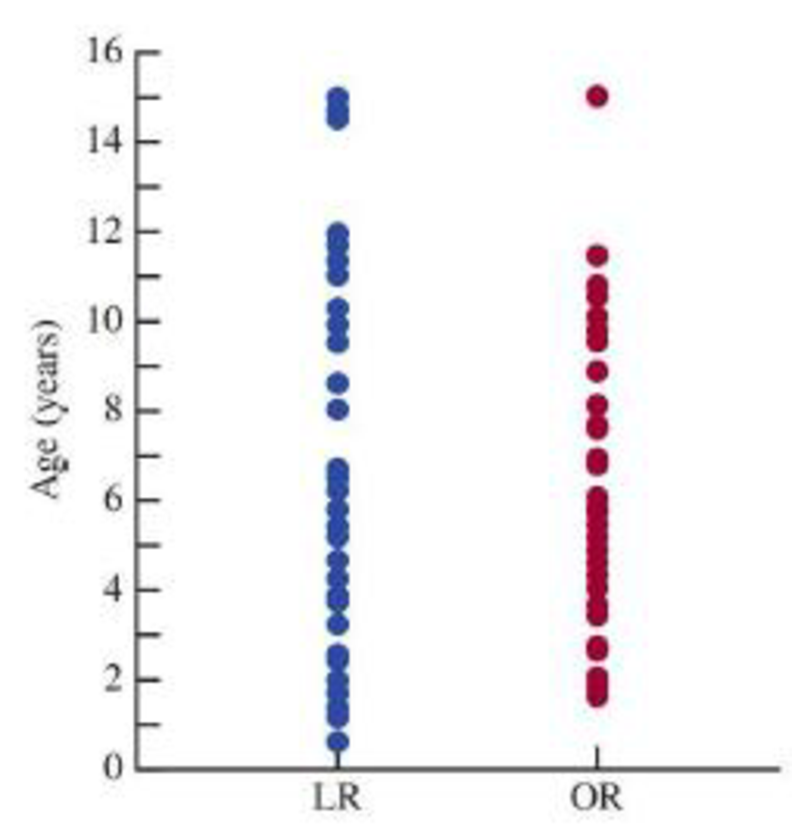
Based on this figure, has the random assignment of subjects to experimental groups been successful in creating groups that are similar with respect to the ages of the children in the groups? Explain.

Trending nowThis is a popular solution!

Chapter 2 Solutions
Introduction To Statistics And Data Analysis
Additional Math Textbook Solutions
Elementary Statistics Using Excel (6th Edition)
EBK STATISTICAL TECHNIQUES IN BUSINESS
Business Statistics: A First Course (8th Edition)
Applied Statistics in Business and Economics
Elementary Statistics ( 3rd International Edition ) Isbn:9781260092561
Developmental Mathematics (9th Edition)


- What is meant by the sample space of an experiment?arrow_forwardWhat is an experiment?arrow_forwardA behavioral scientist investigated whether there is a significant difference in the percentages of men and women who purchase silver-colored cars. The scientist selected a random sample of 50 men and a random sample of 52 women who had recently purchased a new car. Of the men selected, 16 had purchased a silver-colored car. Of the women selected, 9 had purchased a silver-colored car. Which of the following is the most appropriate method for analyzing the results? A two-sample zz-test for the difference in population proportions A A two-sample zz-test for the difference in sample proportions B A one-sample zz-test for a sample proportion C A one-sample zz-test for a population proportion D A one-sample zz-test for a difference in sample proportionsarrow_forward
- An experiment was conducted for better understanding of the effectiveness of a particular type of drug for reducing bad cholesterol (LDL) level. The purpose of the experiment was to determine whether different dosages used have significant different outcomes in average LDL reduction. Twenty subjects with LDL at around 250 to 300 mg/dL had participated in the study and were randomly divided into four groups. Each group was given a specific level of dosage of the drug each day for one month, with a control group that only provided with placebo. The reduction in LDL was recorded and showed in the following table. Positive number indicates reduction and negative numbers indicates increasing in DLD. Use statistical software to analyze the data and answer the following question. Control Light Dosage Level Medium Dosage Level Heavy Dosage Level 7 25 73 81 -3 17 60 71 6 22 55 79 5 21 41 60 15 12 36 85 Perform a One-way…arrow_forwardBeard et al. (Lancet, 1982:455) described a randomised trial to determine if a low sodium diet was an effective substitute for pharmacological control of hypertension. 90 patients on medication for mild hypertension were allocated at random into two groups. The 45 participants in the intervention group (diet group) were encouraged to adopt a diet free from sodium. The other 45 participants (control group) were asked to continue their usual diet. All the participants were kept under close surveillance to see if it was possible to discontinue the medication for hypertension without detriment. In the diet group, medication was discontinued for 14 participants and in the control group for 4 participants. Draw a 2 by 2 table Carry out a significance test to compare the intervention (diet group) and control group with respect to discontinuation of medication for hypertension Write a brief report on your conclusion.arrow_forwardIn a study made on the value of proctoscopy in diarrheal disorders of infancy, 82 randomly selected patients admitted to the University of Santo Tomas Hospital from May 1983 to July 1983 were studied. Of the 82 patients, 65 were cases of diarrhea and the remaining 17 patients served as the control. The diarrhea group had been classified into infectious and non-infectious based on the results of the bacteriologic and viral studies on fecal samples. The infectious group was further subdivided into toxigenic and tissue-invasive according to the etiologic agent isolated. All of the patients underwent improvised proctoscopy and the appearance of the rectal mucosa was noted. In the control group, 16 (94.1%) had pink rectal mucosa and only 1 (5.8%) was noted to have erythematous mucosa. Of the 9 patients belonging to the tissue-invasive subgroup, 8 (88.8%) had erythema and bleeding of the mucosa, while 1 (11%) had only erythema. In contrast, those in toxigenic diarrhea subgroup showed…arrow_forward
- Vitamin E and the Risk of Prostate Cancer: Klien et al (2011) conducted the following study to determine the effect of vitamin E and selenium treatment on the risk of developing prostate cancer in healthy men. A total of 34,887 men from different study sites in the United States, Canada, and Puerto Rico were randomly selected. To be eligible to participate, the men had to take a rectal examination that showed he was not suspicious of having prostate cancer and be aged 50 years or older for black men and 55 years or older for all others. Each man was randomly assigned to receive one of four treatments: selenium, vitamin E, selenium and vitamin E together, or a placebo. The men were followed up after 8 years to see if they had developed prostate cancer or not. The main question of interest is to determine if the risk of developing prostate cancer differs by the treatment taken. The data are summarized in the table below: No Prostate Cancer Prostate Cancer Total Selenium 8,752 8,737 8,702…arrow_forwardDoes heavy cell phone use affect brain activity? There is some concern about possible negative effects of radiofrequency signals delivered to the brain. In a randomized matched-pairs study, 47 healthy participants had cell phones placed on the left and right ears. Brain glucose metabolism (a measure of brain activity) was measured for all participants under two conditions: with one cell phone turned on for 50 minutes (the “on” condition) and with both cell phones off (the “off” condition). The amplitude of radio frequency waves emitted by the cell phones during the “on” condition was also measured. Is this an example of “paired-samples” or “independent samples”? The investigators were interested in seeing whether average brain glucose metabolism was different based on whether the cell phones were turned on or off. State the null and alternative hypotheses for this test. Suppose that the mean of differences ? is 0.8, ignoring the unit for now, and the standard deviation of the…arrow_forwardTrichotillomania is a psychiatric illness that causes its victims to have an irresistible compulsion to pull their own hair. Two drugs were compared as treatments for trichotillomania in a study involving 13 women. Each women took clomipramine during one time period and desipramine during another time period in a double-blind experiment. Scores on a trichotillomania-impairment scale, in which high scores indicate greater impairment, were measured on each women during time period. The average of the 13 measurements for clomipramine was 6.2; the average of the 13 measurements for desipramine as 4.2. (a) A paired t test was used to test whether the mean difference between these two drugs is 0, resulting in a test statistics t∗ = 2.47. Find the sample standard deviation Sd. (b) Find a 95% confidence interval for the mean difference between the two drugs and give the conclusion.arrow_forward
- A large clinical trial of the effect of diet on breast cancer assigned women at random to either a normal diet or a low-fat diet. To check that the random assignment did produce comparable groups, we can compare the two groups at the start of the study. Asked if there is a family history of breast cancer, 3396 of the 19,541 women in the low-fat group and 4929 of the 29,294 women in the control group said “yes.” Does this data provide evidence of a difference in the observed proportions of a family history of breast cancer? Assume α = .05; show work. What are the null hypothesis H0 and the alternative hypothesis Ha. Identify the rejection region. Compute the test statistic State your conclusion, using α = .05. What is the p-value of the test statistic?arrow_forwardSubjects with pre-existing cardiovascular symptoms who were receiving subitramine, an appetite suppressant, were found to be at increased risk of cardiovascular events while taking the drug. The study included 9719 overweight or obese subjects with preexisting cardiovascular disease and/ or type 2 diabetes. The subjects were randomly assigned to subitramine (4787 subjects) or a placebo (4932 subjects) in a double-blind fashion. The primary outcome measured was the occurrence of any of the following events: nonfatal myocardial infarction or stroke, resuscitation after cardiac arrest, or cardiovascular death. The primary outcome was observed in 557 subjects in the subitramine group and 505 subjects in the placebo group. Do the data give good reason to think that there is a difference between the proportions of treatment and placebo subjects who experienced the primary outcome? (a) State hypotheses, find the test statistic and use either software or Table A for the P-value. Give both the…arrow_forwardSubjects with pre‑existing cardiovascular symptoms who were receiving subitramine, an appetite suppressant, were found to be at increased risk of cardiovascular events while taking the drug. The study included 9645 overweight or obese subjects with preexisting cardiovascular disease and/ or type 22 diabetes. The subjects were randomly assigned to subitramine (4798 subjects) or a placebo (4847 subjects) in a double‑blind fashion. The primary outcome measured was the occurrence of any of the following events: nonfatal myocardial infarction or stroke, resuscitation after cardiac arrest, or cardiovascular death. The primary outcome was observed in 552 subjects in the subitramine group and 491 subjects in the placebo group. Do the data give good reason to think that there is a difference between the proportions of treatment and placebo subjects who experienced the primary outcome? (a) State hypotheses, find the test statistic and use either software or Table A for the ? Give both the test…arrow_forward
 College Algebra (MindTap Course List)AlgebraISBN:9781305652231Author:R. David Gustafson, Jeff HughesPublisher:Cengage Learning