
Concept explainers
Videos
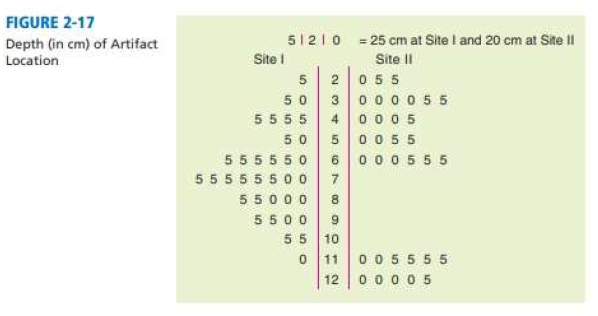
Expand Your Knowledge: Back-to-Back Stem Plot In archaeology, the depth (below surface grade) at which artifacts are found is very important. Greater depths sometimes indicate older artifacts, perhaps from a different archaeological period. Figure 2-17 is a back-to-back stem plot showing the depths of artifact locations at two different archaeological sites. These sites are from similar geographic locations. Notice that the stems are in the center of the diagram. The leaves for Sue I artifact depths are shown to the left the stem. While the leaves for Site II are to the right of the stem (Reference: Mimbres Mogollon Archaeology by A. I. Woosley and A. J. McIntyre. University of New Mexico Press).
(a) What are the least and greatest depths of artifact finds at Site I? at Site II?
(b) Describe the data distribution of depths of artifact finds at Site I and at Site II.
(c) Interpretation At Site II. there is a gap in the depths at which artifacts were found. Does the Site II data distribution suggest that there might have been a period of no occupation?

Trending nowThis is a popular solution!

Learn your wayIncludes step-by-step video

Chapter 2 Solutions
Understanding Basic Statistics


- The slope of the roof shown here is measured with a 12” level and a ruler. What is the slope of this roof?arrow_forwardUse the information given in Figure 1 to find x, h, s, and r if y=3. (Note: s is the distance from A to D. and y is the distance from D to B .)arrow_forwardA zero correlation between X and Y is least likely to ocurr if A. The plot of points for X and Y form a parabola B. The plot of points for X and Y form a cloud pattern C. The plot of points for X and Y almost fit on a straight line with 45 degree incline D. The plot of points for X and Y almost fit on a straight line with a 90 degree inclinearrow_forward
- stem. leaf 3 0 0 1 1 2 4 5 6 9 4 1 5 5 6 5 6 7 7 6 0 1 7 8 9 9 describe shape center peaks and spread.arrow_forwardimage q.arrow_forwardSuppose the professor wants the scores to be curved in a way that results in the following: Top 10% of scores receive an A Bottom 10% of scores receive an F Scores between the 70th and 90th percentile receive a B Scores between the 30th and 70th percentile receive a C Scores between the 10th and 30th percentile receive a D Find the range of scores that would qualify for each grade under this plan.arrow_forward
- Summarized on the right is the sale (in thousands) of the five best-selling cars in 2003. What percent greater were the sales of car D than car A? ... Question content area top right Part 1 A bar graph titled "Best-Selling Cars in 2003" with vertical axis labeled from 0 to 160 plus in increments of 20 and horizontal axis labeled with the letters A through E from left to right contains vertical bars with labeled heights as follows: A, 130; B, 120; C, 92; D, 148; E, 119. Best-Selling Cars in 2003 ABCDE 020406080100120140160 130 120 92 148 119 Question content area bottom Part 1 The sales of car D were enter your response here% greater than the sales of car A. (Round to two decimal places as needed.)arrow_forwardThe data represents the heights of eruptions by a geyser. Use the heights to construct a stemplot. Identify the two values that are closest to the middle when the data are sorted in order from lowest to highest. Which plot represents a stemplot of the data? O A. 3089 4036 5004 6 008 7 001 8004 903 ★ B. 3 8 4 09 500038 6 01468 70004 803 90 Identify the two values that are closest to the middle when the data are sorted in order from lowest to highest. inches. The values closest to the middle are inches and Type whole numbers. Use ascending order.) C C. 38 4013468 50004 6 003 7 0089 80 90 Height of eruption (in.) 66 38 50 90 80 50 40 70 50 64 74 53 58 61 68 60 70 70 49 83arrow_forwardThe data represents the heights of eruptions by a geyser. Height of eruption (in.) 900 67 39 50 Use the heights to construct a stemplot. Identify the two values that are closest to the middle when the data are sorted in order from lowest to highest. 80 50 40 70 50 60 78 53 54 64 62 60 76 70 44 85 Which plot represents a stemplot of the data? OA. 3|9 4 0 4 500034 OB. 3 |0 44 4037 5000 6 00 2 7lo04 8 l0 68 Oc. 39 4 0023 47 50068 6005 7lo04 4 80 6 00247 70068 805 9 10 9 05 9 0 Identify the two values that are closest to the middle when the data are sorted in order from lowest to highest. The values closest to the middle are inches and inches. (Type whole numbers. Use ascending order.)arrow_forward
 Algebra & Trigonometry with Analytic GeometryAlgebraISBN:9781133382119Author:SwokowskiPublisher:Cengage
 Holt Mcdougal Larson Pre-algebra: Student Edition...AlgebraISBN:9780547587776Author:HOLT MCDOUGALPublisher:HOLT MCDOUGAL
 Mathematics For Machine TechnologyAdvanced MathISBN:9781337798310Author:Peterson, John.Publisher:Cengage Learning,
 Algebra: Structure And Method, Book 1AlgebraISBN:9780395977224Author:Richard G. Brown, Mary P. Dolciani, Robert H. Sorgenfrey, William L. ColePublisher:McDougal Littell
 Trigonometry (MindTap Course List)TrigonometryISBN:9781305652224Author:Charles P. McKeague, Mark D. TurnerPublisher:Cengage Learning
 Elementary Geometry for College StudentsGeometryISBN:9781285195698Author:Daniel C. Alexander, Geralyn M. KoeberleinPublisher:Cengage Learning