
Videos
Archaeology: Tree-King DataThe Sand Canyon Archaeological Project, edited by W. D. Lipe and published by Crow Canyon Archaeological Center, contains the stem-and-leaf diagram shown in Figure 2-19. The study uses tree ringsto accurately determine the year in which a tree was cut. The figure gives the tree-ring-cutting dates for samples of timbers found in the architectural units at Sand Canyon Pueblo. The text referring to the figure says. "The three-digit numbers in the left column represent centuries and decades
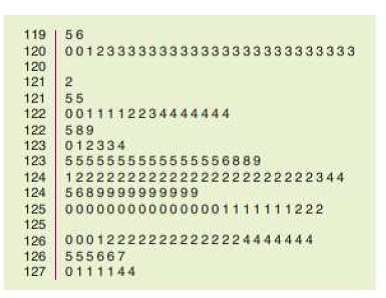
(a) Which decade contained the most samples?
(b) How many samples had a tree-ring-cutting date between 100
(c) What are the dates of the longest interval during which no tree-cutting samples occurred? What might this indicate about new construction or renovation of the pueblo structures during this period?

Trending nowThis is a popular solution!

Chapter 2 Solutions
Understanding Basic Statistics


- Find the metal area of the washer in Figure 29-6. Round the answer to the nearest tenth.arrow_forwardplease look at the image for the following hmwkr question and not the transcribed text.arrow_forwardThe table below shows the height of five members of the Tamayo family. Use these data to answer the questions below.arrow_forward
- a) Create a frequency table to organize the data b) Create a frequency histogram for the data ( 1. Write each column- Sum, Tally, Frequency 2. Give the frequency histogram) c) State 2 any trends, patterns or observations in this data? ( Describe each trend in detail ) d) What proportion, as a fraction, of the data has a value of 6 or less? e) What number of data has a value of 9 or greater? f) What percentage of the data has a value of 9 or greater?arrow_forwardWhich of the following is not correct about diagram? O a. Requires drawing skill O b. Depict categorical and geographic data O c. Drawn on plain paper O d. Furnish more accurate informationarrow_forward1) The question screenshot attached down below answer step - by step:arrow_forward
- Answer in writing/drawing on paper please. Thank you.arrow_forwardIf a class of qualitative data set is represented on a pie chart by an angle of 60 degrees , what is the corresponding class frequency for this class if the total frequency of the data set is 300 ?arrow_forwardA reseacher desires to know if the age of a child is related to the number of cavities he or she has.arrow_forward
 Holt Mcdougal Larson Pre-algebra: Student Edition...AlgebraISBN:9780547587776Author:HOLT MCDOUGALPublisher:HOLT MCDOUGAL
 Mathematics For Machine TechnologyAdvanced MathISBN:9781337798310Author:Peterson, John.Publisher:Cengage Learning,