Understanding Basic Statistics
7th Edition
ISBN: 9781305254060
Author: Charles Henry Brase, Corrinne Pellillo Brase
Publisher: Cengage Learning
bartleby

Videos

Textbook Question
Book Icon
Chapter 2.2, Problem 16P

Technology: Cars The following cluster bar graph shows responses from different age groups to questions regarding connectivity and tracking technology found in new cars. A recent Hams Poll asked respondents how much they agreed or disagreed with statements that they

(1)worry that the technologies cause too much distraction and are dangerous;

(2)worry about letting companies know too much about location and driving habits.

(3)worry that insurance rates could increase because of knowledge of driving habits;

(4)think the technologies make driving more enjoyable;

(5) feel safer with the technologies;

(6) feel it is important to stay connected when in vehicle.

Chapter 2.2, Problem 16P, Technology: Cars The following cluster bar graph shows responses from different age groups to

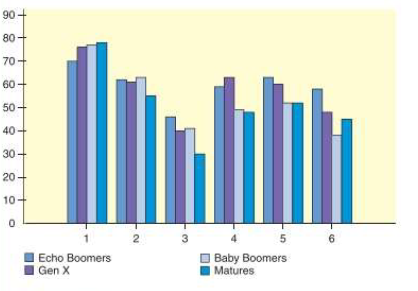
The graph shows the percentage of respondents in each age category who agree strongly or somewhat agree to each of the six statements.

(a) Interpretation Which statement has the highest rale of agreement for all four age groups?

(b) Interpretation Which age group expresses the least worry about insurance companies raising their rates because of the driving habit information collected by the technologies?

(c) Interpretation Which age group ha* the highest percentage of those who find the technologies make driving more enjoy able?

Blurred answer

Chapter 2 Solutions

Understanding Basic Statistics

Ch. 2.1 - Interpretation Histograms of random sample data...Ch. 2.1 - Interpretation The following histograms are based...Ch. 2.1 - Interpretation The ogives shown are based on U.S...Ch. 2.1 - Critical Thinking The following ogives come from...Ch. 2.1 - For Problems 15-20. use the specified number of...Ch. 2.1 - For Problems 15-20, use the specified number of...Ch. 2.1 - For Problems 15-20, use the specified number of...Ch. 2.1 - For Problems 15-20, use the specified number of...Ch. 2.1 - Prob. 19PCh. 2.1 - Prob. 20PCh. 2.1 - Expand Your knowledge: Decimal Data The fallowing...Ch. 2.1 - Decimal Data: Batting Averages The following data...Ch. 2.1 - Expand Your Knowledge: Dotplot another display...Ch. 2.1 - 24. Dotplot: Sled Dog Racing Make a dotplot for...Ch. 2.1 - Prob. 25PCh. 2.2 - 1. Interpretation Consider graph (a) of Reasons...Ch. 2.2 - Interpretation Look at graph (b) of Reasons People...Ch. 2.2 - Critical Thinking A personnel office is gathering...Ch. 2.2 - Critical Thinking Your friend is thinking about...Ch. 2.2 - Prob. 5PCh. 2.2 - Interpretation Consider the two graphs depicting...Ch. 2.2 - Commercial Fishing: Gulf of Alaska It's not an...Ch. 2.2 - Archaeology: Ireland Commercial dredging...Ch. 2.2 - Lifestyle: Hide the Mess! A survey of 1000 adults...Ch. 2.2 - Education: College Professors' Time How do college...Ch. 2.2 - FBI Report: Hawaii In the Aloha state, you are...Ch. 2.2 - Driving: Bad Habits Driving would be more pleasant...Ch. 2.2 - Prob. 13PCh. 2.2 - Vital Statistics: Height How dies average height...Ch. 2.2 - Expand Your Knowledge Donut Pie Charts The book...Ch. 2.2 - Technology: Cars The following cluster bar graph...Ch. 2.3 - Cowboys: Longevity How long did real cowboys live?...Ch. 2.3 - Ecology: Habitat Wetlands offer a diversity of...Ch. 2.3 - Prob. 3PCh. 2.3 - Health Care: Hospitals Using the number of...Ch. 2.3 - Prob. 5PCh. 2.3 - Prob. 6PCh. 2.3 - Are cigarettes bad for people? Cigarette smoking...Ch. 2.3 - Are cigarettes bad for people? Cigarette smoking...Ch. 2.3 - Are cigarettes bad for people? Cigarette smoking...Ch. 2.3 - Expand Your Knowledge: Back-to-Back Stem Plot In...Ch. 2 - Critical Thinking Consider these types of graphs:...Ch. 2 - Critical Thinking A consumer interest group is...Ch. 2 - Critical Thinking Describe how data outliers might...Ch. 2 - Expand Your Knowledge How are dotplots and...Ch. 2 - Focus Problem: Fuel Economy Solve the focus...Ch. 2 - Criminal Justice: Prisoners The time plot in...Ch. 2 - IRS: Tax Returns Almost everyone files (or will...Ch. 2 - Prob. 8CRCh. 2 - Prob. 9CRCh. 2 - Law: Corporation Lawsuits Many people say the...Ch. 2 - Archaeology: Tree-King DataThe Sand Canyon...Ch. 2 - Interpretation A Harm Poll surveyed 2085 U.S....Ch. 2 - Examine Figure 2-20, Everyone Agrees: Slobs Make...Ch. 2 - Examine Figure 2-21, Global Teen Worries. How many...Ch. 2 - In your own words, explain the differences among...Ch. 2 - What do we mean when we say a histogram is skewed...Ch. 2 - Discuss the statement that stem-and-leaf displays...Ch. 2 - The following tables show the first-round winning...Ch. 2 - The following tables show the first-round winning...Ch. 2 - The Following tables show the first-round winning...
Knowledge Booster
Background pattern image
Statistics
Learn more about
Need a deep-dive on the concept behind this application? Look no further. Learn more about this topic, statistics and related others by exploring similar questions and additional content below.
Recommended textbooks for you
Text book image
Glencoe Algebra 1, Student Edition, 9780079039897...
Algebra
ISBN:9780079039897
Author:Carter
Publisher:McGraw Hill
Text book image
Big Ideas Math A Bridge To Success Algebra 1: Stu...
Algebra
ISBN:9781680331141
Author:HOUGHTON MIFFLIN HARCOURT
Publisher:Houghton Mifflin Harcourt
Chi Square test; Author: Vectors Academy;https://www.youtube.com/watch?v=f53nXHoMXx4;License: Standard YouTube License, CC-BY