
Videos
Criminal Justice: Prisoners The time plot in Figure 2-18 gives the number of state and federal prisoners per 100,000 population (Source: Statistical Abstract of the United States. 120th edition).
(a) Estimate the number of prisoners per 100.000 people for 1980 and for 1997. (b) Interpretation During the period shown. there was increased prosecution of drug offenses, longer sentences for common crimes, and reduced access to parole. What does the time-series graph say about the prison population change per 100,000 people?
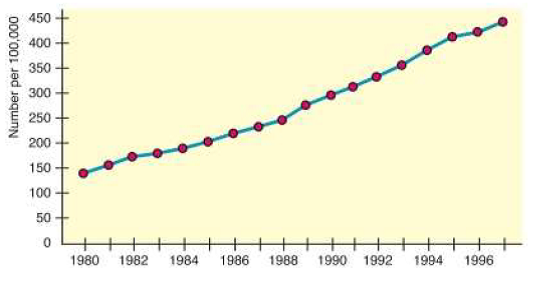
(c) In 1997, the U.S. population was approximately 266,574,000 people. At the rate of 444 prisoners per 100,000 population. about how many prisoners were in the system? The projected U.S. population for the year 2020 is

Trending nowThis is a popular solution!

Chapter 2 Solutions
Understanding Basic Statistics


- Table 6 shows the year and the number ofpeople unemployed in a particular city for several years. Determine whether the trend appears linear. If so, and assuming the trend continues, in what year will the number of unemployed reach 5 people?arrow_forwardOil ProductionThe following table shows the amount of crude oil in billions of barrels produced in the United States in recent years. Source: U.S. Energy Information Administration. Year Crude Oil Produced 2002 2.097 2003 2.060 2004 1.989 2005 1.893 2006 1.857 2007 1.853 2008 1.830 2009 1.954 2010 2.000 2011 2.063 2012 2.377 In this exercise we are interested in the total amount of crude oil produced over the 10-year period from mid-2002 to mid-2012, using the data for the 11 years above. One approach is to sum up the numbers in the second column, but only count half of the first and last numbers. Give the answer to this calculation. Approximate the amount of crude oil produced over the 10-year period 2002-2012 by taking the average of the left endpoint sum and the right endpoint sum. Explain why this is equivalent to the calculation done in part a. This is also equivalent to a formula known as the trapezoidal rule, discussed in the next chapter. If your calculator has a cubic regression feature, find the best-fitting cubic function for these data, letting t=0 correspond to 2000. Then integrate this equation over the interval [2.12] to estimate the amount of crude oil produced over this time period. Compare with your answer to part a.arrow_forward
 Linear Algebra: A Modern IntroductionAlgebraISBN:9781285463247Author:David PoolePublisher:Cengage Learning
 Calculus For The Life SciencesCalculusISBN:9780321964038Author:GREENWELL, Raymond N., RITCHEY, Nathan P., Lial, Margaret L.Publisher:Pearson Addison Wesley,
 Glencoe Algebra 1, Student Edition, 9780079039897...AlgebraISBN:9780079039897Author:CarterPublisher:McGraw Hill