
MATLAB: An Introduction with Applications
6th Edition
ISBN: 9781119256830
Author: Amos Gilat
Publisher: John Wiley & Sons Inc
expand_more
expand_more
format_list_bulleted
Related questions
Question
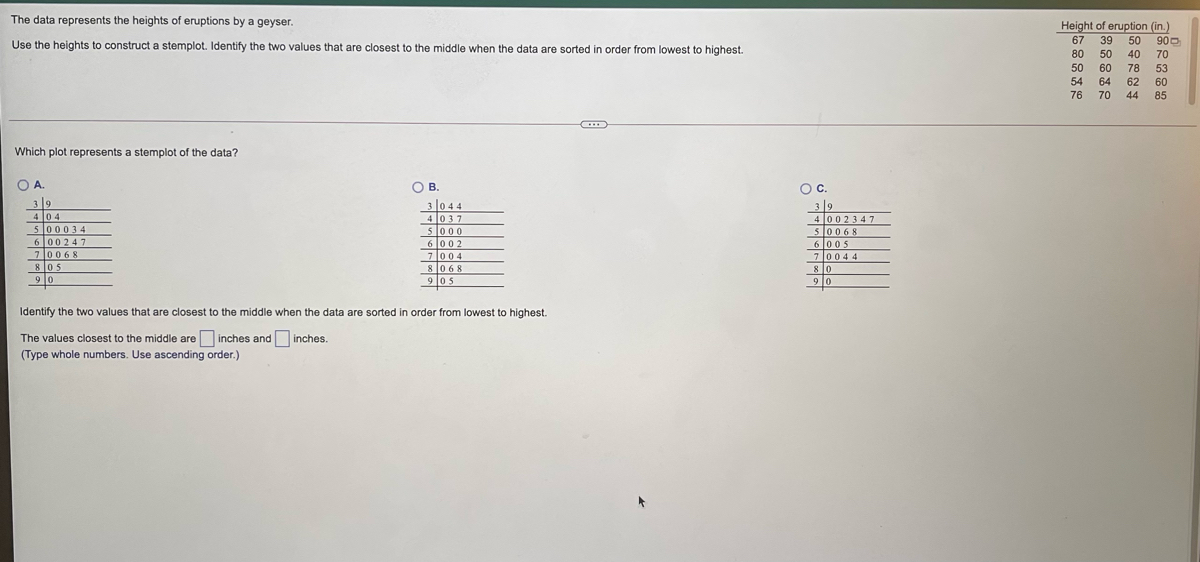

Transcribed Image Text:The data represents the heights of eruptions by a geyser.
Height of eruption (in.)
900
67
39
50
Use the heights to construct a stemplot. Identify the two values that are closest to the middle when the data are sorted in order from lowest to highest.
80
50
40
70
50
60
78
53
54
64
62
60
76
70
44
85
Which plot represents a stemplot of the data?
OA.
3|9
4 0 4
500034
OB.
3 |0 44
4037
5000
6 00 2
7lo04
8 l0 68
Oc.
39
4 0023 47
50068
6005
7lo04 4
80
6 00247
70068
805
9 10
9 05
9
0
Identify the two values that are closest to the middle when the data are sorted in order from lowest to highest.
The values closest to the middle are inches and inches.
(Type whole numbers. Use ascending order.)
Expert Solution
arrow_forward
Step 1

Trending nowThis is a popular solution!

Step by stepSolved in 3 steps with 1 images

Knowledge Booster

Similar questions
- The data in the accompanying table represent the length of life, in years, measured to the nearest tenth, of 30 similar fuel pumps. Complete parts (a) through (c) below. Click the icon to view the fuel pump data. (a) Construct a stem-and-leaf plot for the life in years of the fuel pumps, using the digit to the left of the decimal point as the stem for each observation. Stem Leaf Frequency Get more help. Fuel Pump Life Spans 2.4 3.3 0.4 3.1 1.3 0.2 0.5 5.6 5.9 6.2 0.5 2.4 1.4 4.3 6.3 1.7 4.9 0.2 4.6 0.4 1.5 0.5 2.3 4.8 1.0 5.6 5.9 6.0 1.2 0.2 Print Done -X eck answarrow_forwardUse a stem-and-leaf plot to display the data, which represent the thickness (in centimeters) of ice measured at 20 different locations on a frozen lake. Describe any patterns. 5.8 6.3 6.9 7.2 5.1 4.9 4.6 5.8 7.0 6.8 8.2 7.5 7.2 5.8 7.2 8.0 7.4 6.9 5.9 4.9 Determine the leaves in the stem-and-leaf plot below. Key: 3|3 = 3.3 Ice Thickness 6| 8 What best describes the data? A. Most thicknesses are greater than 7 centimeters. B. Most thicknesses are 6 centimeters. C. Most thicknesses are between 5 and 8 centimeters. D. Most thicknesses are less than 5 centimeters.arrow_forwardTHIS o pts possible Submit Test ut ti The data represents the heights of eruptions by a geyser. Use the heights to construct a stemplot. Identify the two values that are closest to the middle when the data are sorted in order from lowest to highest Height of eruption (in.) 67 32 50 90 70 80 50 40 50 68 72 51 60 59 65 60 77 70 42 83 H. 臺 Which plot represents a stemplot of the data? A. O B. OC. 3 2 402 500019 6 00578 70027 803 3 2 4 001578 5 0027 6 003 70029 8 0 9 0 3029 4 017 5008 6 000 7005 8027 9 03 Gr 9 0 Identify the two values that are closest to the middle when the data are sorted in order from lowest to highest. The values closest to the middle are inches and inches. (Type whole numbers. Use ascending order.)arrow_forward
- The data represents the heights of eruptions by a geyser. Use the heights to construct a stemplot. Identify the two values that are closest to the middle when the data are sorted in order from lowest to highest. Height of eruption (in.) 69 37 50 90- 80 50 40 70 50 64 72 57 59 69 67 60 77 70 48 86 Which plot represents a stemplot of the data? A. 37 408 500079 604799 70027 806 90 B. 3 089 4079 5 004 6 007 7009 8 027 906 Identify the two values that are closest to the middle when the data are sorted in order from lowest to highest. The values closest to the middle are inches and inches. (Type whole numbers. Use ascending order.) ○ C. 37 4047799 50027 6006 70089 80 90arrow_forwardDirections: Identify the region where each of the given values falls. Region B Region A Region C -3 -2.5 -2 -1.5 -1 -0.5 0.5 1 1.5 2 2.5 1. t= 1.95 2. t = 0.15 3. t= -1.45 4. t= -2.4 5. t= 2.73 Answer the following questions. 1. Are you familiar with the shape of the curve used in Activity 1? 2. What is the name of that curve? 3. In what type of distribution is this kind of curve used? 4. How were you able to locate in which region the given value falls? 5. What mathematical concepts did you apply in locating the region?arrow_forwardThe data represents the heights of eruptions by a geyser. Use the heights to construct a stemplot. Identify the two values that are closest to the middle when the data are sorted in order from lowest to highest. Height of eruption (in.) 65 31 50 90 80 50 40 70 67 73 52 50 54 68 63 60 Which plot represents a stemplot of the data? OA. 3 4023578 50037 6008 70034 80 90 B. 31 4 03 5 00024 603578 70037 808 90 Identify the two values that are closest to the middle when the data are sorted in order from lowest to highest. The values closest to the middle are ☐ inches and ☐ inches. (Type whole numbers. Use ascending order.) C. 3 034 4 025 5 007 6003 7 008 8 037 9 08 77 70 43 88arrow_forward
- help pleasearrow_forwardhelp please answer in text form with proper workings and explanation for each and every part and steps with concept and introduction no AI no copy paste remember answer must be in proper format with all workingarrow_forwardE Use a stem-and-leaf plot that has two rows for each stem to display the data, which represent the income (in millions) of 30 of the highest paid athletes. Describe any patterns. 76 45 34 35 36 44 50 35 56 56 44 43 81 53 38 73 68 46 63 38 87 34 34 42 45 58 Determine the leaves in the stem-and-leaf plot below. Key: 313-33 Income ($ millions) 3 What best describes the data? 站 F2 R OA. Most of the incomes are less than 60 million dollars. OB. Most of the incomes are between 50 and 70 million dollars. OC. The incomes are evenly spread between 30 and 90 million dollars. OD. Most of the incomes are greater than 60 million dollars. V % 5 F4 T G B Y H N F5 46 53 U J 37 41 F6 ( 8 M K 9 F8 L P Alt Gr DELL F9 N F10 TE F11 1 T F12 - Intro Power Impant Sleep Pet Sis Insert Blog Despl Wake ONLOFF Supr Inicioarrow_forward
- Please draw a scatter plot based on the data shown! Thank you!arrow_forwardHAV is a deformation of the big toe that often requires surgery. Doctors used X-rays to measure the angle (in degrees) of deformity in 38 consecutive patients under the age of 21 who came to a medical center for surgery to correct HAV. The angle is a measure of the seriousness of the deformity. Here are the data. 292216 321828 231529 352322 372249 261623 263328 202530 321933 242138 262230 112023 2124 It is reasonable to regard these patients as a random sample of young patients who require HAV surgery. Given a 95% confidence interval for the mean HAV angle in the population of all such patients, find the following. x (mean) = s=(standard deviation) = Confidence Interval: ° to ° Conclusion 1) We are 95% confident that the mean HAV angle among such patients is within this interval. 2) We are 95% confident that the mean HAV angle among such patients is outside this interval. 3) The mean HAV angle among such patients will always be outside this interval 95% of…arrow_forwardHeights of a basketball player is what kind of variabarrow_forward
arrow_back_ios
arrow_forward_ios
Recommended textbooks for you
- MATLAB: An Introduction with ApplicationsStatisticsISBN:9781119256830Author:Amos GilatPublisher:John Wiley & Sons Inc
 Probability and Statistics for Engineering and th...StatisticsISBN:9781305251809Author:Jay L. DevorePublisher:Cengage Learning
 Statistics for The Behavioral Sciences (MindTap C...StatisticsISBN:9781305504912Author:Frederick J Gravetter, Larry B. WallnauPublisher:Cengage Learning
  Elementary Statistics: Picturing the World (7th E...StatisticsISBN:9780134683416Author:Ron Larson, Betsy FarberPublisher:PEARSON
 The Basic Practice of StatisticsStatisticsISBN:9781319042578Author:David S. Moore, William I. Notz, Michael A. FlignerPublisher:W. H. Freeman
 Introduction to the Practice of StatisticsStatisticsISBN:9781319013387Author:David S. Moore, George P. McCabe, Bruce A. CraigPublisher:W. H. Freeman
MATLAB: An Introduction with Applications
Statistics
ISBN:9781119256830
Author:Amos Gilat
Publisher:John Wiley & Sons Inc
Probability and Statistics for Engineering and th...
Statistics
ISBN:9781305251809
Author:Jay L. Devore
Publisher:Cengage Learning
Statistics for The Behavioral Sciences (MindTap C...
Statistics
ISBN:9781305504912
Author:Frederick J Gravetter, Larry B. Wallnau
Publisher:Cengage Learning
Elementary Statistics: Picturing the World (7th E...
Statistics
ISBN:9780134683416
Author:Ron Larson, Betsy Farber
Publisher:PEARSON
The Basic Practice of Statistics
Statistics
ISBN:9781319042578
Author:David S. Moore, William I. Notz, Michael A. Fligner
Publisher:W. H. Freeman
Introduction to the Practice of Statistics
Statistics
ISBN:9781319013387
Author:David S. Moore, George P. McCabe, Bruce A. Craig
Publisher:W. H. Freeman