
Introductory Statistics (10th Edition)
10th Edition
ISBN: 9780321989178
Author: Neil A. Weiss
Publisher: PEARSON
expand_more
expand_more
format_list_bulleted
Videos
Textbook Question
Chapter 2.3, Problem 105E
Parkinson’s Disease. Parkinson’s disease affects internally generated movements such as movements recalled from memory. L-Dopa is a drug that is used in clinical treatment of Parkinson’s disease. In the article, “L-Dopa Induces Under-Damped Visually Guided Motor Responses in Parkinson’s Disease” (Experimental Brain Research, Vol. 202, Issue 3, pp. 553–559), Wing-Lok Au et al. explore the effects of L-Dopa on patients with Parkinson’s disease. Following is a stem-and-leaf diagram of the ages, in years, at which a sample of 14 patients experienced the onset of symptoms of Parkinson’s disease.
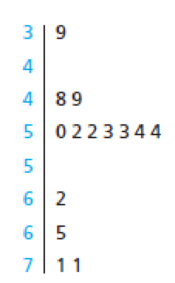
How many of these 14 patients were
- a. under 45 years old at the onset of symptoms?
- b. at least 65 years old at the onset of symptoms?
- c. between 50 years old and 64 years old, inclusive, at the onset of symptoms?
Expert Solution & Answer
Want to see the full answer?
Check out a sample textbook solution
Students have asked these similar questions
Parkinson’s Disease. Parkinson’s disease affects internally generated movements such as movements recalled from memory. L-Dopa is a drug that is used in clinical treatment of Parkinson’s disease. In the article, “L-Dopa Induces Under-DampedVisually Guided Motor Responses in Parkinson’s Disease” (Experimental Brain Research, Vol. 202, Issue 3, pp. 553–559), Wing-Lok Au et al. explore the effects of L-Dopa on patients with Parkinson’s disease. Following is a stem-and-leaf diagram of the ages, in years, at which a sample of 14 patients experienced the onset of symptoms of Parkinson’s disease.
How many of these 14 patients were
a. under 45 years old at the onset of symptoms?
b. at least 65 years old at the onset of symptoms?
c. between 50 years old and 64 years old, inclusive, at the onset of symptoms?
Augmented Reality (AR) is a technology that superimposes a computer-generated image on a user's view of the real world, and it is believed that it will soon affect the conventional learning process. A random sample of nine university students was selected to test for the effectiveness of a special course on augmented reality in learning. They were taught how to incorporate AR into their learning process to its full potential. Table 1 gives the scores in a Learning Effectiveness test given to these students before and after attending this course.
Question: Test at the 1% significance level whether this AR course makes any statistically significant improvement in the learning effectiveness of all university students.
Wing Length. D. Cristol et al. published results of their studies of two subspecies of dark-eyed juncos in the paper “Migratory Dark-Eyed Juncos, Junco hyemalis, Have Better Spatial Memory and Denser Hippocampal Neurons Than Nonmigratory Conspecifics” (Animal Behaviour, Vol. 66, Issue 2, pp. 317–328). One of the subspecies migrates each year, and the other does not migrate. A hypothesis test is to be performed to decide whether the mean wing lengths for the two subspecies (migratory and nonmigratory) are different.
a. identify the variable.
b. identify the two populations.
c. determine the null and alternative hypotheses.
d. classify the hypothesis test as two tailed, left tailed, or right tailed.
Chapter 2 Solutions
Introductory Statistics (10th Edition)
Ch. 2.1 - Give an example, other than those presented in...Ch. 2.1 - Explain the meaning of a. qualitative variable. b....Ch. 2.1 - Explain the meaning of a. qualitative data. b....Ch. 2.1 - Provide a reason why the classification of data is...Ch. 2.1 - Of the variables you have studied so far, which...Ch. 2.1 - For each part of Exercises 2.62.11, classify the...Ch. 2.1 - Earthquakes. The U.S. Geological Survey monitors...Ch. 2.1 - Top 10 IPOs. An online article from the Washington...Ch. 2.1 - Earnings from the Crypt. On the Celebrity NetWorth...Ch. 2.1 - World University Rankings. The Times Higher...
Ch. 2.1 - Recording Industry Statistics. The Recording...Ch. 2.1 - RBI Kings. As reported on MLB.com, the five...Ch. 2.1 - Top Broadcast Shows. As reported in Primetime...Ch. 2.1 - The Fulbright Program. The U.S. governments...Ch. 2.1 - Top 10 Green Cars. The following table presents...Ch. 2.1 - Ordinal Data. Another important type of data is...Ch. 2.2 - What is a frequency distribution of qualitative...Ch. 2.2 - Explain the difference between a. frequency and...Ch. 2.2 - Answer true or false to each of the statements in...Ch. 2.2 - In Exercises 2.202.25, we have presented some...Ch. 2.2 - Prob. 21ECh. 2.2 - In Exercises 2.202.25, we have presented some...Ch. 2.2 - Prob. 23ECh. 2.2 - In Exercises 2.202.25, we have presented some...Ch. 2.2 - In Exercises 2.202.25, we have presented some...Ch. 2.2 - For each data set in Exercises 2.262.31, a....Ch. 2.2 - For each data set in Exercises 2.262.31, a....Ch. 2.2 - For each data set in Exercises 2.262.31, a....Ch. 2.2 - For each data set in Exercises 2.262.31, a....Ch. 2.2 - For each data set in Exercises 2.262.31, a....Ch. 2.2 - For each data set in Exercises 2.262.31, a....Ch. 2.2 - In each of Exercises 2.322.37, we have presented a...Ch. 2.2 - In each of Exercises 2.322.37, we have presented a...Ch. 2.2 - In each of Exercises 2.322.37, we have presented a...Ch. 2.2 - In each of Exercises 2.322.37, we have presented a...Ch. 2.2 - In each of Exercises 2.322.37, we have presented a...Ch. 2.2 - Prob. 37ECh. 2.2 - Health Status. The National Center for Health...Ch. 2.2 - In Exercises 2.392.41, use the technology of your...Ch. 2.2 - Prob. 40ECh. 2.2 - In Exercises 2.392.41, use the technology of your...Ch. 2.3 - Identify an important reason for grouping data.Ch. 2.3 - Do the concepts of class limits, marks, cutpoints,...Ch. 2.3 - State three of the most important guidelines in...Ch. 2.3 - With regard to grouping quantitative data into...Ch. 2.3 - For quantitative data, we examined three types of...Ch. 2.3 - We used slightly different methods for determining...Ch. 2.3 - Explain the difference between a frequency...Ch. 2.3 - Explain the advantages and disadvantages of...Ch. 2.3 - For data that are grouped in classes based on more...Ch. 2.3 - Discuss the relative advantages and disadvantages...Ch. 2.3 - Suppose that you have a data set that contains a...Ch. 2.3 - Suppose that you have constructed a stem-and-leaf...Ch. 2.3 - In each of Exercises 2.542.59, we have presented a...Ch. 2.3 - In each of Exercises 2.542.59, we have presented a...Ch. 2.3 - In each of Exercises 2.542.59, we have presented a...Ch. 2.3 - In each of Exercises 2.542.59, we have presented a...Ch. 2.3 - Prob. 58ECh. 2.3 - In each of Exercises 2.542.59, we have presented a...Ch. 2.3 - Prob. 60ECh. 2.3 - Prob. 61ECh. 2.3 - In Exercises 2.602.71, we have presented some...Ch. 2.3 - In Exercises 2.602.71, we have presented some...Ch. 2.3 - In Exercises 2.602.71, we have presented some...Ch. 2.3 - In Exercises 2.602.71, we have presented some...Ch. 2.3 - Prob. 66ECh. 2.3 - In Exercises 2.602.71, we have presented some...Ch. 2.3 - In Exercises 2.602.71, we have presented some...Ch. 2.3 - Prob. 69ECh. 2.3 - In Exercises 2.602.71, we have presented some...Ch. 2.3 - In Exercises 2.602.71, we have presented some...Ch. 2.3 - Prob. 72ECh. 2.3 - In each of Exercises 2.722.75, construct a dotplot...Ch. 2.3 - Prob. 74ECh. 2.3 - In each of Exercises 2.722.75, construct a dotplot...Ch. 2.3 - In each of Exercises 2.762.79, construct a...Ch. 2.3 - Prob. 77ECh. 2.3 - In each of Exercises 2.762.79, construct a...Ch. 2.3 - Prob. 79ECh. 2.3 - Prob. 80ECh. 2.3 - For each data set in Exercises 2.802.91, use the...Ch. 2.3 - For each data set in Exercises 2.802.91, use the...Ch. 2.3 - For each data set in Exercises 2.802.91, use the...Ch. 2.3 - For each data set in Exercises 2.802.91, use the...Ch. 2.3 - For each data set in Exercises 2.802.91, use the...Ch. 2.3 - For each data set in Exercises 2.802.91, use the...Ch. 2.3 - Prob. 87ECh. 2.3 - Prob. 88ECh. 2.3 - Prob. 89ECh. 2.3 - Prob. 90ECh. 2.3 - Prob. 91ECh. 2.3 - Prob. 92ECh. 2.3 - Age of Passenger Cars. According to R. L. Polk ...Ch. 2.3 - Stressed-Out Bus Drivers. Frustrated passengers,...Ch. 2.3 - Acute Postoperative Days. Several neurosurgeons...Ch. 2.3 - MMs. In the article Sweetening StatisticsWhat MMs...Ch. 2.3 - Women in the Workforce. In an issue of Science...Ch. 2.3 - Process Capability. R. Morris and E. Watson...Ch. 2.3 - University Patents. The number of patents a...Ch. 2.3 - Prob. 100ECh. 2.3 - Prob. 101ECh. 2.3 - Adjusted Gross Incomes. The Internal Revenue...Ch. 2.3 - Cholesterol Levels. According to the National...Ch. 2.3 - Hospital Beds. The number of hospital beds...Ch. 2.3 - Parkinsons Disease. Parkinsons disease affects...Ch. 2.3 - The Great White Shark. In an article titled Great...Ch. 2.3 - The Beatles. In the article, Length of The Beatles...Ch. 2.3 - High School Completion. As reported by the U.S....Ch. 2.3 - Prob. 109ECh. 2.3 - Body Temperature. A study by researchers at the...Ch. 2.3 - Exam Scores. The exam scores for the students in...Ch. 2.3 - Prob. 112ECh. 2.3 - Prob. 113ECh. 2.3 - Age and Gender. The following bivariate data on...Ch. 2.3 - Prob. 115ECh. 2.3 - Clocking the Cheetah. Construct a...Ch. 2.3 - Prob. 117ECh. 2.3 - Residential Energy Consumption. Refer to the...Ch. 2.3 - Prob. 119ECh. 2.3 - Cardiovascular Hospitalizations. The Florida State...Ch. 2.3 - Prob. 121ECh. 2.4 - In each of Exercises 2.1222.127, explain the...Ch. 2.4 - In each of Exercises 2.1222.127, explain the...Ch. 2.4 - In each of Exercises 2.1222.127, explain the...Ch. 2.4 - Prob. 125ECh. 2.4 - Prob. 126ECh. 2.4 - Prob. 127ECh. 2.4 - Prob. 128ECh. 2.4 - Suppose that a variable of a population has a...Ch. 2.4 - Prob. 130ECh. 2.4 - Identify and sketch three distribution shapes that...Ch. 2.4 - Prob. 132ECh. 2.4 - In each of Exercises 2.1322.139, we have drawn a...Ch. 2.4 - In each of Exercises 2.1322.139, we have drawn a...Ch. 2.4 - In each of Exercises 2.1322.139, we have drawn a...Ch. 2.4 - In each of Exercises 2.1322.139, we have drawn a...Ch. 2.4 - In each of Exercises 2.1322.139, we have drawn a...Ch. 2.4 - In each of Exercises 2.1322.139, we have drawn a...Ch. 2.4 - Prob. 139ECh. 2.4 - In each of Exercises 2.1402.149, we have provided...Ch. 2.4 - In each of Exercises 2.1402.149, we have provided...Ch. 2.4 - Prob. 142ECh. 2.4 - In each of Exercises 2.1402.149, we have provided...Ch. 2.4 - In each of Exercises 2.1402.149, we have provided...Ch. 2.4 - In each of Exercises 2.1402.149, we have provided...Ch. 2.4 - In each of Exercises 2.1402.149, we have provided...Ch. 2.4 - Prob. 147ECh. 2.4 - Prob. 148ECh. 2.4 - Prob. 149ECh. 2.4 - Old Faithful. Old Faithful is a geyser in...Ch. 2.4 - SnowGoose Nests. In the article Trophic...Ch. 2.4 - Prob. 152ECh. 2.4 - In each of Exercises 2.1522.157, a. use the...Ch. 2.4 - In each of Exercises 2.1522.157, a. use the...Ch. 2.4 - Prob. 155ECh. 2.4 - In each of Exercises 2.1522.157, a. use the...Ch. 2.4 - In each of Exercises 2.1522.157, a. use the...Ch. 2.4 - Standard Normal Distribution. One of the most...Ch. 2.5 - Give one reason why constructing and reading...Ch. 2.5 - Prob. 163ECh. 2.5 - Reading Skills. Each year the director of the...Ch. 2.5 - Americas Melting Pot. The U.S. Census Bureau...Ch. 2.5 - Prob. 167ECh. 2.5 - Drunk-Driving Fatalities. Drunk-driving fatalities...Ch. 2.5 - Prob. 169ECh. 2.5 - Prob. 170ECh. 2.5 - Prob. 171ECh. 2 - This problem is about variables. a. What is a...Ch. 2 - This problem is about data. a. What are data? b....Ch. 2 - For a qualitative data set, what is a a. frequency...Ch. 2 - What is the relationship between a frequency or...Ch. 2 - Identify two main types of graphical displays that...Ch. 2 - In a bar chart, unlike in a histogram, the bars do...Ch. 2 - Some users of statistics prefer pie charts to bar...Ch. 2 - When is the use of single-value grouping...Ch. 2 - A quantitative data set has been grouped by using...Ch. 2 - A quantitative data set has been grouped by using...Ch. 2 - A quantitative data set has been grouped by using...Ch. 2 - A quantitative data set has been grouped by using...Ch. 2 - Explain the relative positioning of the bars in a...Ch. 2 - Sketch the curve corresponding to each of the...Ch. 2 - Draw a smooth curve that represents a symmetric...Ch. 2 - Prob. 16RPCh. 2 - Largest Hydroelectric Plants. According to...Ch. 2 - DVD Players. Refer to Example 2.16 on page 60. a....Ch. 2 - Inauguration Ages. From the Information Please...Ch. 2 - Inauguration Ages. Refer to Problem 19. Construct...Ch. 2 - Prob. 21RPCh. 2 - Prob. 22RPCh. 2 - Busy Bank Tellers. The Prescott National Bank has...Ch. 2 - On-Time Arrivals. The Air Travel Consumer Report...Ch. 2 - Old Ballplayers. From the ESPN Web site, we...Ch. 2 - Prob. 26RPCh. 2 - U.S. Divisions. The U.S. Census Bureau divides the...Ch. 2 - Prob. 28RPCh. 2 - Prob. 29RPCh. 2 - Hair and Eye Color. In the article Graphical...Ch. 2 - Prob. 31RPCh. 2 - In Problems 3133, a. identify the population and...Ch. 2 - In Problems 3133, a. identify the population and...Ch. 2 - UWEC UNDERGRADUATES Recall from Chapter 1 (see...Ch. 2 - Recall that, each year, Forbes magazine publishes...
Knowledge Booster


Learn more about
Need a deep-dive on the concept behind this application? Look no further. Learn more about this topic, statistics and related others by exploring similar questions and additional content below.Similar questions
- us. What does this suggest? Source: Pegna, Alan J. et al., "Discriminating Emotional Faces without Primary Visual Cortices Involves the Right Amygdala." Nature Neuroscience, 8(1), 2005. 28. Reproducibility Researchers looked at studies that were reported in newspapers with the goal of determining whether initial studies had results that could be reproduced. Reproducibility of results means that subsequent analysis confirms the conclusion of the original study. Primary studies are studies where the researchers come up with a research objective, clearly state the goals of the study and population, describe the research method, test the research hypotheses, and draw conclusions. (a) Among the 156 primary studies reported by newspapers, 76 had results that were validated by subsequent analysis. Does this suggest less than a majority of initial studies reported by newspapers have their results validated by subsequent analysis? (b) In the article, a null effect is defined as any study where…arrow_forwardAugmented Reality (AR) is a technology that superimposes a computer-generated image on a user's view of the real world, and it is believed that it will soon affect the conventional learning process. A random sample of nine university students was selected to test for the effectiveness of a special course on augmented reality in learning. They were taught how to incorporate AR into their learning process to its full potential. Table 1 gives the scores in a Learning Effectiveness test given to these students before and after attending this course. Construct a 95% confidence interval for the mean (mean difference) of the population paired differences.arrow_forwardLIGHT AT NIGHT MAKES FAT MICE Studies have shown that exposure to light at night is harmful to human health. A study in mice shows that light at night has an effect on weight gain after just three weeks. In the study, mice were randomly assigned to live in one of three light conditions: LD had a standard light/dark cycle, LL had bright light all the time, and DM had dim light when there normally would have been darkness. Body Mass Gain The mice in the study had body mass measured throughout the study. Computer output showing an analysis of variance table to test for a difference in mean body mass gain (in grams) after four weeks between mice in the three different light conditions is shown below. The conditions for ANOVA are met. The null hypothesis is that the amount of light at night does not affect how much weight is gained. The alternative hypothesis is that the amount of light at night has some effect on mean weight gain. Level N Mean StDev Part 1 (a) What is the F-statistic? The…arrow_forward
- Maintaining your balance may get harder as you grow older. A study was conducted to see how steady the elderly is on their feet. They had the subjects stand on a force platform and have them react to a noise. The force platform then measured how much they swayed forward and backward, and the data is in table #7.3.10 ("Maintaining balance while," 2013). Do the data show that the elderly sway more than the mean forward sway of younger people, which is 18.125 mm? Test at the 5% level. Table #7.3.10: Forward/backward Sway (in mm) of Elderly Subjects 19 30 20 19 29 25 21 24 50arrow_forwardQ. No. 3: Recently airlines have cut services, such as meals and snacks during flights, and started charging extra for some services, such as accommodating overweight luggage, last-minute flight changes, and pets traveling in the cabin. However, they are still concerned about service. Recently, a group of four carriers hired Brunner Marketing Research Inc. to survey passengers regarding their level of satisfaction with a recent flight. The survey included questions on ticketing, boarding, in-flight service, baggage handling, pilot communication, and so forth. Twenty-five questions offered a range of possible answers: excellent, good, fair, or poor. A response of excellent was given a score of 4, good a 3, fair a 2, and poor a 1. These responses were then totaled, so the total score was an indication of the satisfaction with the flight. The greater the score, the higher the level of satisfaction with the service. The highest possible score was 100. Brunner randomly selected and surveyed…arrow_forwardResearchers have recently hypothesized that patients with myotonic dystrophy (a neuromuscular disease) also have hyperparathyroidism, a syndrome caused by an overactive parathyroid gland. To test this hypothesis, they measured the body’s response to a calcium challenge in patients with myotonic dystrophy, patients with other types of dystrophy (nonmyotonic dystrophy), and normal subjects. One of the biochemical variables they measured was the amount of cAMP excreted by the kidneys. Elevated renal cAMP excretion would be consistent with hyperparathyroidism. The data is contained in the screenshot, where two variables are listed: cAMP – Amount of cAMP excreted by the kidneys, measured in nmol/dL. patient – A factor defining the clinical status of the patient, with three levels: 1, Normal Patient in control group, with no disease. 2, Myotonic Patient with myotonic dystrophy. 3, Nonmyotonic Patient with nonmyotonic dystrophy. (a) Perform an analysis of variance calculation to test the…arrow_forward
- What is a main effect? an interaction?arrow_forward2. Do children diagnosed with attention deficit/hyperactivity disorder (ADHD) have smaller brains than children without this condition? This question was the topic of a research study described in the paper "Developmental Trajectories of Brain Volume Abnormalities in Children and Adolescents with Attention Deficit/Hyperactivity Disorder" (Journal of the American Medical Association [2002]: 1740–1747). Brain scans were completed for 152 children with ADHD and 139 children of similar age without ADHD. Summary values for total cerebral volume (in milliliters) are given in the following table: Children with ADHD 152 1059.4 117.5 Children without ADHD 139 1104.5 111.3 Do these data provide evidence that the mean brain volume of children with ADHD is smaller than the mean for children without ADHD? Let's test the relevant hypoth- eses using a .05 level of significance.arrow_forwardAn article in Medicine and Science in Sports and Exercise "Electrostimulation Training Effects on the Physical Performance of Ice Hockey Players," (2005, Vol. 37, pp. 455-460) considered the use of electromyostimulation (EMS) as a method to train healthy skeletal muscle. EMS sessions consisted of 30 contractions (four-second duration, 85 Hz) and were carried out three times per week for three weeks on 17 ice hockey players. The ten-meter skating performance test showed a standard deviation of 0.09 seconds. Construct a 99% confidence interval of the standard deviation of the skating performance test. Assume population is approximately normally distributed. Round your answers to 3 decimal places. i << iarrow_forward
- What is meant by the term main effect? What is an interaction effectarrow_forwardExercises 5–8 refer to the study of an association between which ear is used for cell phone calls and whether the subject is left-handed or right-handed. The study is reported in “Hemispheric Dominance and Cell Phone Use,” by Seidman et al., JAMA Otolaryngology—Head & Neck Surgery, Vol. 139, No. 5. The study began with a survey e-mailed to 5000 people belonging to an otology online group, and 717 surveys were returned. (Otology relates to the ear and hearing.) Sampling Method What type of sampling best describes the way in which the 717 subjects were chosen: simple random sample, systematic sample, convenience sample, stratified sample, cluster sample? Does the method of sampling appear to adversely affect the quality of the results?arrow_forwardExercises 5–8 refer to the study of an association between which ear is used for cell phone calls and whether the subject is left-handed or right-handed. The study is reported in “Hemispheric Dominance and Cell Phone Use,” by Seidman et al., JAMA Otolaryngology—Head & Neck Surgery, Vol. 139, No. 5. The study began with a survey e-mailed to 5000 people belonging to an otology online group, and 717 surveys were returned. (Otology relates to the ear and hearing.)arrow_forward
arrow_back_ios
SEE MORE QUESTIONS
arrow_forward_ios
Recommended textbooks for you
 MATLAB: An Introduction with ApplicationsStatisticsISBN:9781119256830Author:Amos GilatPublisher:John Wiley & Sons Inc
 Probability and Statistics for Engineering and th...StatisticsISBN:9781305251809Author:Jay L. DevorePublisher:Cengage Learning
 Statistics for The Behavioral Sciences (MindTap C...StatisticsISBN:9781305504912Author:Frederick J Gravetter, Larry B. WallnauPublisher:Cengage Learning
 Elementary Statistics: Picturing the World (7th E...StatisticsISBN:9780134683416Author:Ron Larson, Betsy FarberPublisher:PEARSON
 The Basic Practice of StatisticsStatisticsISBN:9781319042578Author:David S. Moore, William I. Notz, Michael A. FlignerPublisher:W. H. Freeman
 Introduction to the Practice of StatisticsStatisticsISBN:9781319013387Author:David S. Moore, George P. McCabe, Bruce A. CraigPublisher:W. H. Freeman
MATLAB: An Introduction with Applications
Statistics
ISBN:9781119256830
Author:Amos Gilat
Publisher:John Wiley & Sons Inc
Probability and Statistics for Engineering and th...
Statistics
ISBN:9781305251809
Author:Jay L. Devore
Publisher:Cengage Learning
Statistics for The Behavioral Sciences (MindTap C...
Statistics
ISBN:9781305504912
Author:Frederick J Gravetter, Larry B. Wallnau
Publisher:Cengage Learning
Elementary Statistics: Picturing the World (7th E...
Statistics
ISBN:9780134683416
Author:Ron Larson, Betsy Farber
Publisher:PEARSON
The Basic Practice of Statistics
Statistics
ISBN:9781319042578
Author:David S. Moore, William I. Notz, Michael A. Fligner
Publisher:W. H. Freeman
Introduction to the Practice of Statistics
Statistics
ISBN:9781319013387
Author:David S. Moore, George P. McCabe, Bruce A. Craig
Publisher:W. H. Freeman
Hypothesis Testing using Confidence Interval Approach; Author: BUM2413 Applied Statistics UMP;https://www.youtube.com/watch?v=Hq1l3e9pLyY;License: Standard YouTube License, CC-BY
Hypothesis Testing - Difference of Two Means - Student's -Distribution & Normal Distribution; Author: The Organic Chemistry Tutor;https://www.youtube.com/watch?v=UcZwyzwWU7o;License: Standard Youtube License