
Videos
Stressed-Out Bus Drivers. Frustrated passengers, congested streets, time schedules, and air and noise pollution are just some of the physical and social pressures that lead many urban bus drivers to retire prematurely with disabilities such as coronary heart disease and stomach disorders. An intervention program designed by the Stockholm Transit District was implemented to improve the work conditions of the city’s bus drivers. Improvements were evaluated by G. Evans et al., who collected physiological and psychological data for bus drivers who drove on the improved routes (intervention) and for drivers who were assigned the normal routes (control). Their findings were published in the article “Hassles on the Job: A Study of a Job Intervention With Urban Bus Drivers” (Journal of Organizational Behavior, Vol. 20, pp. 199–208). Following are data, based on the results of the study, for the heart rates, in beats per minute, of the intervention and control drivers.
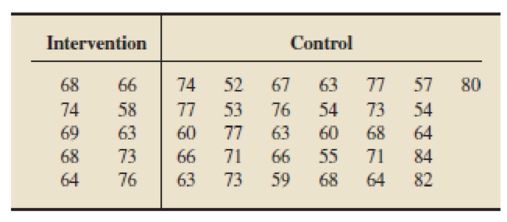
- a. Obtain dotplots for each of the two data sets, using the same scales.
- b. Use your result from part (a) to compare the two data sets.

Trending nowThis is a popular solution!

Chapter 2 Solutions
Introductory Statistics (10th Edition)


- Dr. Farah is an educational psychologist who is interested in studying the potential causal relationship between doing homework and academic achievement. In January, Dr. Farah has her students report their fall GPA (a measure of academic achievement) and estimate how many hours they spent doing homework during a typical week in the fall semester. In May, Dr. Farah measures the same variables again (the estimated number of hours spent doing homework during a typical week in the spring semester and their spring GPA). She finds the following correlations. Imagine that Dr. Farah noted a cyclical, reinforcing relationship between homework and academic achievement. For this to be case, which of the following correlations would need to be significant? a. Correlations 1 and 6 b. Correlations 2 and 5 c. Correlations 3 and 4 d. Correlations 2 and 3 Answer is C for this question. Why this one is the answer and others are not?arrow_forwardDoes posting calorie content for menu items affect people’s choices in fast food restaurants? According to results obtained by Elbel, Gyamfi, and Kersh (2011), the answer is no. The researchers monitored the calorie content of food purchases for children and adolescents in four large fast food chains before and after mandatory labeling began in New York City. Although most of the adolescents reported noticing the calorie labels, apparently the labels had no effect on their choices. Data similar to the results obtained show an average of M = 786 calories per meal with s = 85 for n = 100 children and adolescents before the labeling, compared to an average of M = 772 calories with s = 91 for a similar sample of n = 100 after the mandatory posting. Use a two-tailed test with α = .05 to determine whether the mean number of calories after the posting is significantly different than before calorie content was posted. Calculate r2 to measure effect size for the mean difference.arrow_forwardhe paper "From Dr. Kildare to Grey's Anatomy"† describes several studies of how the way in which doctors are portrayed on television might influence public perception of doctors. One study was described as follows. Rebecca Chory, Ph.D., now an associate professor of communication at West Virginia University, began studying the effect of such portrayals on patients' attitudes toward physicians. Using a survey of 300 undergraduate students, she compared perceptions of physicians in 1992—the end of the era when physicians were shown as all-knowing, wise father figures—with those in 1999, when shows such as ER and Chicago Hope (1994–2000) were continuing the transformation to showing the private side and lives of physicians, including vivid demonstrations of their weaknesses and insecurities. Dr. Chory found that, regardless of the respondents' personal experience with physicians, those who watched certain kinds of television had declining perceptions of physicians' composure and regard…arrow_forward
- The effect of aid is a subject of considerable academic and policy interest. In this question we examine the relationship between foreign aid and civil conflict using a recent paper by Crost et al. (2014) in the Philippines. The authors collect data on civil conflict related incidents at the municipality level as well as information on aid receipts at the municipality level. The conflict data was collected from the Philippine military and provides casualty counts (as well as the party responsible) by municipality. Aid in this context refers to a large anti-poverty program (the KALAHI-CIDSS) funded by the World Bank and run from 2003-2008. The program provided cash grants to municipalities to build infrastructure such as roads, water-systems, clinics and schools. The grants were fairly large and accounted for approximately 15% of the annual budget for the average municipality. (a) Let Yi denote the number of conflict casualties in municipality i in a given timeperiod after the…arrow_forwardAn important issue is whether there are racial differences in hypertension among children. We define hypertension as being above the 95th percentile for either systolic blood pressure (SBP) or diastolic blood pressure (DBP) among children of the same age, height, and sex. Since some of the children were observed at multiple visits, a GEE model was run of hypertension on ethnic group. There were three ethnic groups considered: Caucasian, African American, and Hispanic. One issue is that BMI, which may vary among ethnic groups, is positively related to hypertension. Hence, a logistic regression model was run, as shown in Table 13.55. 13.89 What is the estimated OR for hypertension comparing Hispanic boys vs. Caucasian boys based on the results in Table 13.55? (Call this OR2 .) Provide a 95% CI for this estimate. 13.90 Suppose the average BMI of Hispanic boys is higher than that for Caucasian boys. Is BMI a confounder of the association between ethnic group and hypertension? If so, is it…arrow_forwardAn important issue is whether there are racial differences in hypertension among children. We define hypertension as being above the 95th percentile for either systolic blood pressure (SBP) or diastolic blood pressure (DBP) among children of the same age, height, and sex. Since some of the children were observed at multiple visits, a GEE model was run of hypertension on ethnic group. There were three ethnic groups considered: Caucasian, African American, and Hispanic. The results among boys are given in Table 13.54. TABLE 13.54 Relationship between hypertension and ethnic group among 27,009 boys in the Pediatric Task Force Data Variable Regression Coefficient SE Intercept -2.07 0.026 African American 0.049 0.041 Hispanic 0.328 0.059 What is the estimated OR for hypertension comparing Hispanic boys vs. Caucasian boys? (Call this OR1.) What is a 95% CI for this estimate?arrow_forward
- A study examined the relationship between a nurse's assessment of a patient's facial expression and his or her self-reported level of pain. Data for 89 patients are summarized below: Self-Report Facial Expression No Pain Pain No Pain 17 40 Pain 3 29 We'd like to determine if there is evidence of an association between a facial expression that reflects pain and self-report pain, because dementia patients do not always give a verbal indication that they are in pain. By using SPSS or Minitab, design the appropriate test and generate the data analyses. Relate the results of the test to the research question and conclude the findings.arrow_forwardRecent research indicates that the effectiveness of antidepressant medication is directly related to the severity of the depression (Khan, Brodhead, Kolts & Brown, 2005). Based on pretreatment depression scores, patients were divided into four groups based on their level of depression. After receiving the antidepressant medication, depression scores were measured again and the amount of improvement was recorded for each patient. The following data are similar to the results of the study. LowModerate HighModerate ModeratelySevere Severe 0.3 1.2 2.2 1.8 3.8 1.7 1.4 2.8 3.2 0.4 0.6 2.6 2.3 1.2 1.6 2.6 2 3.2 1.6 2.2 0.6 1.2 1.6 1 2.7 1 2.2 0.6 1.4 1.6 3.3 2.7 2.2 2.9 3.7 2.6 0.9 0.7 3.4 3.1 2.6 1.7 0.8 1.8 2 1.4 1.6 4.1 1.7 0.9 3.3 2.3 1.6 1.1 3.5 1.4 3.5 1.9 0.4 4.2 1.5 2.3 2.2 2.9 1.4 2.2 2.7 2.8 2.1 1.9 1.9 3.9 1.5 2.7 0.8 1.5 1 3 2.1 3.7 1.5 0.9 2.4 1.9 2.7 3.2 0.8 2.7 2.2 2.9 1.8 1.2 2.4 1.7 3.2 1.3 2.2 2.4 1.1 1 2.6 2…arrow_forwardRecent research indicates that the effectiveness of antidepressant medication is directly related to the severity of the depression (Khan, Brodhead, Kolts & Brown, 2005). Based on pretreatment depression scores, patients were divided into four groups based on their level of depression. After receiving the antidepressant medication, depression scores were measured again and the amount of improvement was recorded for each patient. The following data are similar to the results of the study. LowModerate HighModerate ModeratelySevere Severe 2.2 1.4 3.4 3.4 1.5 1.4 3.5 2.8 2.8 3.1 2.7 2.3 1.7 2.6 4.4 3.6 1.3 1.5 2.6 3.2 1.3 2.6 2.8 3.5 Fill in the summary table for the ANOVA test: degrees of freedom (d.f.) Sum of Squares (S.S.) Mean Square (M.S.) Between Within Total From this table, obtain the necessary statistics for the ANOVA:F-ratio (F-test statistic): p-value: η2η2 (Eta squared = Sum of squares betweenSum of squares totalSum…arrow_forward
- Recent research indicates that the effectiveness of antidepressant medication is directly related to the severity of the depression (Khan, Brodhead, Kolts & Brown, 2005). Based on pretreatment depression scores, patients were divided into four groups based on their level of depression. After receiving the antidepressant medication, depression scores were measured again and the amount of improvement was recorded for each patient. The following data are similar to the results of the study. LowModerate HighModerate ModeratelySevere Severe 0.5 2.7 3.4 2.6 1.7 0.8 2.6 5.3 3.3 1.9 1.1 4 2.6 1.4 4.3 2.6 1.4 2.9 3.6 4.6 3.1 3.2 4.8 1.4 From this table, conduct an one-way ANOVA. Calculate the F-ratio and p-value. Be sure to round your answers to three decimal places. Assume all population and ANOVA requirements are met.F-ratio: p-value:arrow_forwardRecent research indicates that the effectiveness of antidepressant medication is directly related to the severity of the depression (Khan, Brodhead, Kolts & Brown, 2005). Based on pretreatment depression scores, patients were divided into four groups based on their level of depression. After receiving the antidepressant medication, depression scores were measured again and the amount of improvement was recorded for each patient. The following data are similar to the results of the study. LowModerate HighModerate ModeratelySevere Severe 2.4 0.2 2.5 3.5 1.6 1.7 2.7 4.3 2.7 3.4 2 3.4 0.5 1.2 5.2 5.1 2.4 2.3 4 3.5 1.8 0.3 4.1 3.8 From this table, conduct an one-way ANOVA. Calculate the F-ratio and p-value. Be sure to round your answers to three decimal places. Assume all population and ANOVA requirements are met.F-ratio: _____p-value: _____What is your final conclusion? Use a significance level of α=0.05. (Select one): There is sufficient evidence that…arrow_forwardThe paper "From Dr. Kildare to Grey's Anatomy"† describes several studies of how the way in which doctors are portrayed on television might influence public perception of doctors. One study was described as follows. Rebecca Chory, Ph.D., now an associate professor of communication at West Virginia University, began studying the effect of such portrayals on patients' attitudes toward physicians. Using a survey of 300 undergraduate students, she compared perceptions of physicians in 1992—the end of the era when physicians were shown as all-knowing, wise father figures—with those in 1999, when shows such as ER and Chicago Hope (1994–2000) were continuing the transformation to showing the private side and lives of physicians, including vivid demonstrations of their weaknesses and insecurities. Dr. Chory found that, regardless of the respondents' personal experience with physicians, those who watched certain kinds of television had declining perceptions of physicians' composure and regard…arrow_forward
 Big Ideas Math A Bridge To Success Algebra 1: Stu...AlgebraISBN:9781680331141Author:HOUGHTON MIFFLIN HARCOURTPublisher:Houghton Mifflin Harcourt
 Glencoe Algebra 1, Student Edition, 9780079039897...AlgebraISBN:9780079039897Author:CarterPublisher:McGraw Hill