
Videos
For each data set in Exercises 2.80–2.91, use the specified grouping method to
- a. determine a frequency distribution.
- b. obtain a relative-frequency distribution.
- c. construct a frequency histogram based on your result from part (a).
- d. construct a relative-frequency histogram based on your result from part (b).
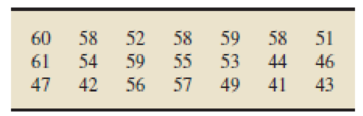
2.85 Early-Onset Dementia. Dementia is a person’s loss of intellectual and social abilities that is severe enough to interfere with judgment, behavior, and daily

Trending nowThis is a popular solution!

Chapter 2 Solutions
Introductory Statistics (10th Edition)


- The frequency distribution shown in the figure lists the annual salaries of the managers at Universal Manufacturing of Melonville. Construct a histogram to represent the data.arrow_forwardFor Exercises 7–10, (a) compute the arithmetic mean and (b) indicate whether it is a 7. There are 10 salespeople employed by Midtown Ford. The number of new cars statistic or a parameter. Sold last month by the respective salespeople were: 15, 23, 4, 19, 18, 10, 10, 0 28, 19. Dve order company counted the number of incoming calls per day to the compa- Ivs toll-free number during the first 7 days in May: 14, 24, 19, 31, 36, 26, 17.arrow_forwardCritical Thinking. For Exercises 5–20, watch out for these little buggers. Each of these exercises involves some feature that is somewhat tricky. Find the (a) mean, (b) median, (c) mode, (d) midrange, and then answer the given question. Football Player Numbers Listed below are the jersey numbers of 11 players randomly selected from the roster of the Seattle Seahawks when they won Super Bowl XLVIII. What do the results tell us?arrow_forward
- Construct a frequency distribution and a relative frequency histogram for the data set using five classes. Which class has the greatest relative frequency and which has the least relative frequency? Complete the table below. Use the minimum data entry as the lower limit of the first class.arrow_forwardGiven the data set below, construct a frequency histogram with 5 classes and label it correctly.arrow_forward2.31 The median income for a four-person family has been reported as shown here for 1993–2003. Source: Time Almanac 2006, p. 627. 1993 $45,161 1999 $59,981 1998 56,061 1994 47,012 2000 62,228 1995 49,687 2001 63,278 1996 51,518 2002 62,732 1997 53,350 2003 65,093 Construct a line graph describing these data over time.arrow_forward
- During one shift, the express lane clerk recorded how many times customers violated the "10 items or less" rule for his lane. In particular, he recorded how many items over the limit each violator placed on the conveyor belt. This data is summarized in the histogram below. NOTE: The last class actually represents "7 or more items," not just 7 items. Frequency 144 12- 10+ 8- 0.5 1.5 2.5 3.5 4.5 5.5 6.5 7.5 #items over 10 Q What is the frequency of times the limit was exceeded by at least 2 items? Answer: timesarrow_forwardUse the following table to answer questions 6–9. Monthly Water Bills Jan Feb Mar Apr May June July Aug Sept Oct Nov Dec $40 $42 $40 $38 $48 $50 $58 $62 $56 $46 $44 $44 6. Write the formula for the mean water bill for the entire year using sigma notation and determine that mean. Round your answer to the nearest cent.arrow_forwardThe data below represent the number of streaming hours listened to per day by a sample of 9 people. Findarrow_forward
- frequency distribution method is used to organize the data when data is nominal and ordinal. a. Categorical frequency distribution b. Grouped frequency distribution c. Ungrouped frequency distribution d. All Optionsarrow_forward2.) Explain why the relative frequency column of a frequency table might not sum to 1.0.arrow_forwardFamily Heights. In Exercises 1–5, use the following heights (in.) The data are matched so that each column consists of heights from the same family. Scatterplot Construct a scatterplot of the father/son heights, then interpret it.arrow_forward
 Holt Mcdougal Larson Pre-algebra: Student Edition...AlgebraISBN:9780547587776Author:HOLT MCDOUGALPublisher:HOLT MCDOUGAL