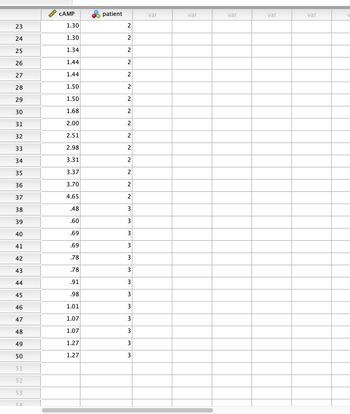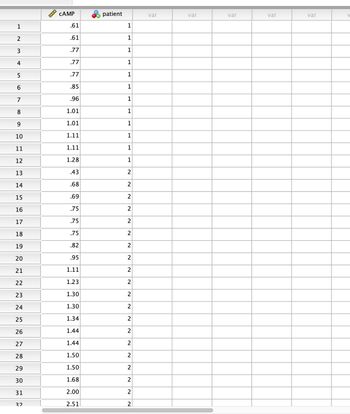
Researchers have recently hypothesized that patients with myotonic dystrophy (a neuromuscular disease) also have hyperparathyroidism, a syndrome caused by an overactive parathyroid gland. To test this hypothesis, they measured the body’s response to a calcium challenge in patients with myotonic dystrophy, patients with other types of dystrophy (nonmyotonic dystrophy), and normal subjects. One of the biochemical variables they measured was the amount of cAMP excreted by the kidneys. Elevated renal cAMP excretion would be consistent with hyperparathyroidism.
The data is contained in the screenshot, where two variables are listed:
- cAMP – Amount of cAMP excreted by the kidneys, measured in nmol/dL.
- patient – A factor defining the clinical status of the patient, with three levels:
- 1, Normal Patient in control group, with no disease.
- 2, Myotonic Patient with myotonic dystrophy.
- 3, Nonmyotonic Patient with nonmyotonic dystrophy.
(a) Perform an analysis of variance calculation to test the null hypothesis that the
(b) Perform both (i) a pairwise comparison with a Bonferonni correction and (ii) a Tukey honest significant differences analysis to determine where the significant differences lie.
(c) Explain whether you conclude that there is evidence that cAMP excretion is elevated in myotonic dystrophic subjects.


Step by stepSolved in 4 steps with 18 images

- Another researcher also decides to conduct a study to observe the association between smoking cessation among long-term smokers and obesity since it has been previously well documented in the literature that smokers tend to gain weight when they stop smoking. The researcher notes that among the individuals who gain weight, many of them have developed heart problems or other medical problems that typically prevent them from exercising as much as their counterparts. In this case the researcher notes that individuals who have developed the heart problems or other medical problems causing them to gain weight also came from family with a high prevalence of risk-taking behaviors so they consume unhealthy diets and are less likely to exercise in general than their counterparts. This is an example of which of the following? Multilpe Choice Confounding Effect modification Recall bias Socially desirable response biasarrow_forwardOne hundred individuals, aged 20-58, were given a test of psychomotor skill. Both age and score were classified in the accompanying table. Age High Ave Low 40 - 59 23 20 17 20 - 39 18 12 10 Test for dependency of the scores obtained in the psychometric test and the individual’s age. Set alpha at 5% level. State your hypothesis and show your solution and state your final conclusion.arrow_forwardA 2012 survey of 417 American adults indicates that 15% of cell phone owners do their browsing on their phone rather than a computer or other device. According to an online article, a report from a mobile research company indicates that 38% of Chinese mobile web users only access the internet through their cell phones. We wish to conduct a hypothesis test to determine if these data provide strong evidence that the proportion of Americans who only use their cell phones to access the internet is less than the Chinese proportion of 38%. (a) The Null Hypothesis, in mathematical symbols, is: H0: p = ______ (b) The Alternative Hypothesis, in mathematical symbols, is: HA : p = _______ In both the null and alternative hypotheses, the symbol ( p ) is the proportion of American adult cell phone owners who do their browsing on their phone. (c) The standard error based on the null hypothesis is... :________ (d) Our data indicates a proportion of Americans who use their phones to browse is…arrow_forward
- An article in the Journal of Human Nutrition and Dietetics [“The Validation of Energy and Protein Intakes by Doubly Labeled Water and 24-Hour Urinary Nitrogen Excretion in Post-Obese Subjects” (1995, Vol. 8, pp. 51–64)] showed the energy intake expressed as a basal metabolic rate, BMR (MJ). 5.40 5.67 5.79 6.85 6.92 5.70 6.08 5.48 5.44 5.51 a. Use a normal probability plot to check the normality assumption. b. Find a 99% two-sided confidence interval on the mean BMR.arrow_forwardReggie is running his stats for a project he just finished. He had participants came in to the lab and gave them a drug treatment (either a control or an experimental compound) at different times during the day (morning, afternoon, and night). Each participant went through all off of the conditions. He ran an ANOVA and tested for the main effects and their interaction. Assuming that only the main effects (and not the interaction) came back significant, interpret his results (no need to include tests statistics).arrow_forwardFatty acids that are present in fish oil may be useful for treating some psychiatric disorders. An article described a randomized experiment done by a medical researcher in which 13 bipolar patients received fish oil daily, while 15 other patients received a placebo daily. After 4 months, 7 of the 13 patients who received fish oil had responded favorably, but only 2 of the 15 placebo patients had done so. (Round your answers to four decimal places.) (a) Calculate the difference between the proportions showing favorable response in the two groups. (Use pfish oil − pplacebo.) Calculate a standard error for this difference. b If you believe that a confidence interval should be calculated using this method, calculate the 95% confidence interval. (If it is not appropriate, enter DNE into both blanks. Round your answers to three decimal places.) __to___arrow_forward
 MATLAB: An Introduction with ApplicationsStatisticsISBN:9781119256830Author:Amos GilatPublisher:John Wiley & Sons Inc
 Probability and Statistics for Engineering and th...StatisticsISBN:9781305251809Author:Jay L. DevorePublisher:Cengage Learning
 Statistics for The Behavioral Sciences (MindTap C...StatisticsISBN:9781305504912Author:Frederick J Gravetter, Larry B. WallnauPublisher:Cengage Learning
 Elementary Statistics: Picturing the World (7th E...StatisticsISBN:9780134683416Author:Ron Larson, Betsy FarberPublisher:PEARSON
 The Basic Practice of StatisticsStatisticsISBN:9781319042578Author:David S. Moore, William I. Notz, Michael A. FlignerPublisher:W. H. Freeman
 Introduction to the Practice of StatisticsStatisticsISBN:9781319013387Author:David S. Moore, George P. McCabe, Bruce A. CraigPublisher:W. H. Freeman


