
Concept explainers
Videos
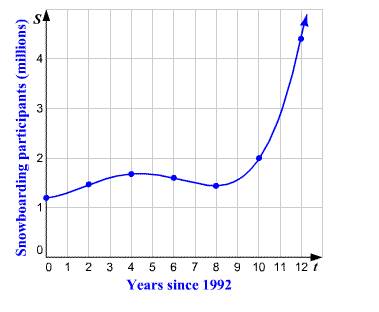
To graph: The model and to estimate the first year that the number of snowboarding participants was greater than
Graph is as follows.

The number of snowboarding participants was greater than
Given information:
From
where
Graph:
Make a table of values.
Since
Plot the points and connect them with a smooth curve.
Since the degree is even and the leading coefficient is positive, the graph tends to rise to the right.
Examine the graph to find the first year that the number of snowboarding participants was greater than
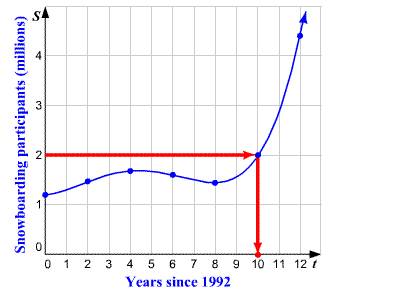
From the graph, it is clear that the number of participants was greater than
Thus, the number of snowboarding participants was greater than
Chapter 2 Solutions
Holt Mcdougal Larson Algebra 2: Student Edition 2012


 Algebra and Trigonometry (6th Edition)AlgebraISBN:9780134463216Author:Robert F. BlitzerPublisher:PEARSON
 Contemporary Abstract AlgebraAlgebraISBN:9781305657960Author:Joseph GallianPublisher:Cengage Learning
 Linear Algebra: A Modern IntroductionAlgebraISBN:9781285463247Author:David PoolePublisher:Cengage Learning
 Algebra And Trigonometry (11th Edition)AlgebraISBN:9780135163078Author:Michael SullivanPublisher:PEARSON
 Introduction to Linear Algebra, Fifth EditionAlgebraISBN:9780980232776Author:Gilbert StrangPublisher:Wellesley-Cambridge Press
 College Algebra (Collegiate Math)AlgebraISBN:9780077836344Author:Julie Miller, Donna GerkenPublisher:McGraw-Hill Education