
Videos
a.
To graph: The given function on the domain
In the year 2003, the most CD singles were sold.
Given information:
From
Calculation:
Upon graphing the given function, the required graph would look like as shown below:
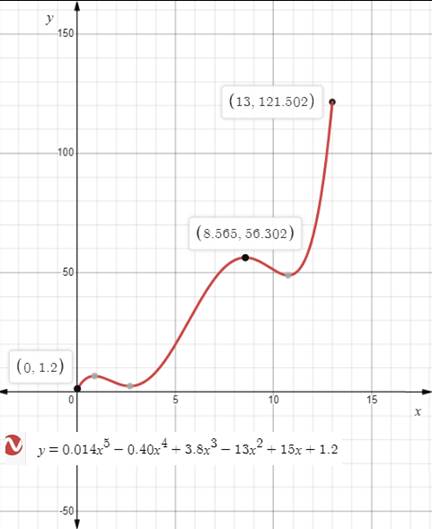
It is visible that the maximum volume occurs when
Therefore, the most CD singles were sold in 2003.
b.
To determine: Do you think that sales will continue to follow the model indefinitely? Explain your reasoning.
The sales will follow the model in the long run.
Given information:
From
Explanation:
From the graph in part (a), it is visible that the function is increasing without bound as x approaches towards positive infinity. But practically it is not possible as new technologies may replace CD singles.
Therefore, the sales will continue to follow the model indefinitely.
Chapter 2 Solutions
Holt Mcdougal Larson Algebra 2: Student Edition 2012


 Algebra and Trigonometry (6th Edition)AlgebraISBN:9780134463216Author:Robert F. BlitzerPublisher:PEARSON
 Contemporary Abstract AlgebraAlgebraISBN:9781305657960Author:Joseph GallianPublisher:Cengage Learning
 Linear Algebra: A Modern IntroductionAlgebraISBN:9781285463247Author:David PoolePublisher:Cengage Learning
 Algebra And Trigonometry (11th Edition)AlgebraISBN:9780135163078Author:Michael SullivanPublisher:PEARSON
 Introduction to Linear Algebra, Fifth EditionAlgebraISBN:9780980232776Author:Gilbert StrangPublisher:Wellesley-Cambridge Press
 College Algebra (Collegiate Math)AlgebraISBN:9780077836344Author:Julie Miller, Donna GerkenPublisher:McGraw-Hill Education