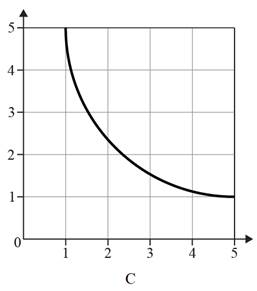
Interpretation: The graph which shows an inversely proportional relationship is to be determined.
Concept introduction: In an inverse proportion, when one variable grows, the other variable decreases, and vice versa.
Answer to Problem 9STP
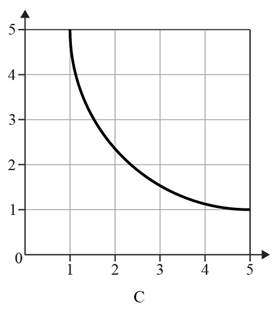
The correct option is (C).
The graph shows an inversely proportional relationship is given below.

Explanation of Solution
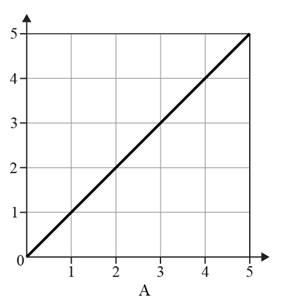
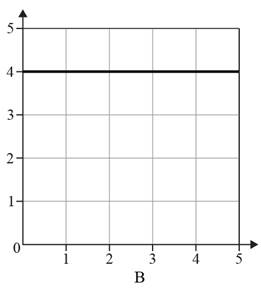
The given option of the graphs are as follows:
Reason for the correct option:
A graph showing an inversely proportional relationship is not a straight line with a negative gradient. Inversely proportional graphs are reciprocal graphs that consist of a single smooth curve in the first quadrant. When one quantity increases, the other quantity should decrease, and vice versa. Therefore, graph C depicts a line with a slope of zero.
Reason for the incorrect options
In graphs A and B value of one variable increases with the decrease in the value of another variable and vice versa. Therefore, graphs A and B do not show an inversely proportional relationship.
Chapter 14 Solutions
Chemistry 2012 Student Edition (hard Cover) Grade 11

 ChemistryChemistryISBN:9781305957404Author:Steven S. Zumdahl, Susan A. Zumdahl, Donald J. DeCostePublisher:Cengage Learning
 ChemistryChemistryISBN:9781259911156Author:Raymond Chang Dr., Jason Overby ProfessorPublisher:McGraw-Hill Education
 Principles of Instrumental AnalysisChemistryISBN:9781305577213Author:Douglas A. Skoog, F. James Holler, Stanley R. CrouchPublisher:Cengage Learning
 Organic ChemistryChemistryISBN:9780078021558Author:Janice Gorzynski Smith Dr.Publisher:McGraw-Hill Education
 Chemistry: Principles and ReactionsChemistryISBN:9781305079373Author:William L. Masterton, Cecile N. HurleyPublisher:Cengage Learning
 Elementary Principles of Chemical Processes, Bind...ChemistryISBN:9781118431221Author:Richard M. Felder, Ronald W. Rousseau, Lisa G. BullardPublisher:WILEY