
Concept explainers
Videos
To Explain: that the perform a complete analysis of Darwin’s data that includes data a significance test and a confidence interval and follow the four-step statistical.
Answer to Problem 10.50E
There is enough evidence to reject the claim that self-fertilizing and cross-fertilizing leads to the same height in plant
Explanation of Solution
Given:
Formula used:
For confidence intervals
Calculation:
Let us assume:
Step 1:
Here are going to perform a significance test the claim that there is no difference in the two groups and it is calculated a
Step 2:
Collecting the data
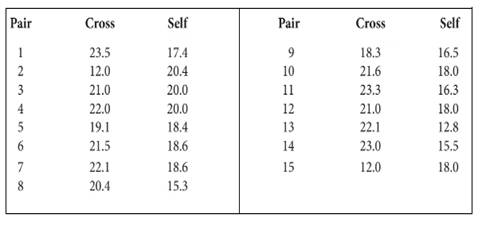
The sample contains 15 pairs:
The difference between self-fertilized and cross- fertilized for each
| Sample 1 | Sample 2 | Difference D |
| 23.5 | 17.4 | 6.1 |
| 12 | 20.4 | -8.4 |
| 21 | 20 | 3 |
| 22 | 20 | 2 |
| 19.1 | 18.4 | 0.7 |
| 21.5 | 18.6 | 2.9 |
| 22.1 | 18.6 | 3.5 |
| 20.4 | 15.3 | 5.1 |
| 18.3 | 16.5 | 1.8 |
| 21.6 | 18 | 3.6 |
| 23.3 | 16.3 | 7 |
| 21 | 18 | 3 |
| 22.1 | 12.8 | 9.3 |
| 23 | 15.5 | 7.5 |
| 12 | 18 | -6 |
The mean is
The variance is
Step 3:
Analyzing the data
SIGNIFICANCE TEST
The claim is either the null hypothesis or the alternative hypothesis .the null hypothesis statement is that the population mean is equal to the value given in the claim. If the null hypothesis is the claim, then the alternative hypothesis statement is the opposite of null hypothesis.
The value of the test statistic is
The P-value is the probability of getting the value of the test statistic, or a value more extreme; assume that the null hypothesis is true. For the P-value
If the P-value is lesser than the significance level
The t-value by looking in the row starting with degrees of freedom
The margin of error is
The confidence intervals are
Step 4:
There is enough evidence to reject the claim that self-fertilizing and cross-fertilizing leads to the same height in plant. There are 95% confident that the mean height of the cross-fertilization is between
Chapter 10 Solutions
Statistics Through Applications
Additional Math Textbook Solutions
Introductory Statistics (10th Edition)
Elementary Statistics (13th Edition)
Basic Business Statistics, Student Value Edition (13th Edition)
Elementary Statistics Using Excel (6th Edition)
Essentials of Statistics (6th Edition)
An Introduction to Mathematical Statistics and Its Applications (6th Edition)


 MATLAB: An Introduction with ApplicationsStatisticsISBN:9781119256830Author:Amos GilatPublisher:John Wiley & Sons Inc
 Probability and Statistics for Engineering and th...StatisticsISBN:9781305251809Author:Jay L. DevorePublisher:Cengage Learning
 Statistics for The Behavioral Sciences (MindTap C...StatisticsISBN:9781305504912Author:Frederick J Gravetter, Larry B. WallnauPublisher:Cengage Learning
 Elementary Statistics: Picturing the World (7th E...StatisticsISBN:9780134683416Author:Ron Larson, Betsy FarberPublisher:PEARSON
 The Basic Practice of StatisticsStatisticsISBN:9781319042578Author:David S. Moore, William I. Notz, Michael A. FlignerPublisher:W. H. Freeman
 Introduction to the Practice of StatisticsStatisticsISBN:9781319013387Author:David S. Moore, George P. McCabe, Bruce A. CraigPublisher:W. H. Freeman