
Videos
(a)
To Explain: the state null and alternative hypotheses in terms of the mean difference in times for the population of all adults.
(a)
Answer to Problem 10.55E
Explanation of Solution
Given:
Claim: Mean difference is higher than 0 (faster)
The claim is either the null hypothesis or the alternative hypothesis .the null hypothesis statement is that the population mean is equal to the value given in the claim. If the null hypothesis is the claim, then the alternative hypothesis statement is of the null hypothesis.
(b)
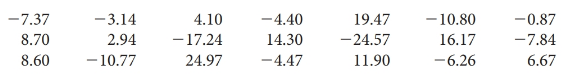
To find: the mean and standard deviation of the 21 observations and the subjects work faster with the scented mask and the mean improvement big enough to be important.
(b)
Answer to Problem 10.55E
Mean=0.9571
Standard deviation= 12.5481
Explanation of Solution
Formula used:
Calculation:
The mean is
The sample contains
The variance is
(c)
To construct: a stem plot of the data and explain and about outliers.
(c)
Answer to Problem 10.55E
No outlier.
Explanation of Solution
Given:
Calculation:
Rounding all data values to the closet integer:
-7, -3, 4, -4, 19, -11, -1, 9, 3, -17, 14, -25, 16, -8, 9, -11, 25, -4, 12, -6, 7
Graph:
Stem plot
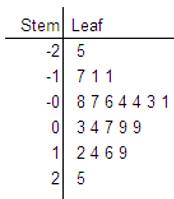
By seeing the stem plot, it is observed that there not appear to be outlines, because there are no having gaps in the stem plot. It is not showing any other problems that might higher inferences, because the stem plot is about symmetric and therefore not strongly skewed.
(d)
To Explain: that the state hypotheses improvement statistically significant.
(d)
Answer to Problem 10.55E
It is failed to reject the null hypothesis and the improvement is not statistically significant.
Explanation of Solution
Formula used:
Calculation:
The value of the test statistic is
The P-value is the probability of getting the value of the test statistic, or a value more extreme; assume that the null hypothesis is true.
If the P-value is lesser than the significance level
It is failed to reject the null hypothesis and the improvement is not statistically significant.
Chapter 10 Solutions
Statistics Through Applications
Additional Math Textbook Solutions
Elementary Statistics: Picturing the World (7th Edition)
Statistics: The Art and Science of Learning from Data (4th Edition)
Essentials of Statistics, Books a la Carte Edition (5th Edition)
Introductory Statistics
Basic Business Statistics, Student Value Edition (13th Edition)


 MATLAB: An Introduction with ApplicationsStatisticsISBN:9781119256830Author:Amos GilatPublisher:John Wiley & Sons Inc
 Probability and Statistics for Engineering and th...StatisticsISBN:9781305251809Author:Jay L. DevorePublisher:Cengage Learning
 Statistics for The Behavioral Sciences (MindTap C...StatisticsISBN:9781305504912Author:Frederick J Gravetter, Larry B. WallnauPublisher:Cengage Learning
 Elementary Statistics: Picturing the World (7th E...StatisticsISBN:9780134683416Author:Ron Larson, Betsy FarberPublisher:PEARSON
 The Basic Practice of StatisticsStatisticsISBN:9781319042578Author:David S. Moore, William I. Notz, Michael A. FlignerPublisher:W. H. Freeman
 Introduction to the Practice of StatisticsStatisticsISBN:9781319013387Author:David S. Moore, George P. McCabe, Bruce A. CraigPublisher:W. H. Freeman