
Concept explainers
Videos
(a)
To Calculate: the percent that explain the nature of the relationship between time.
(a)
Explanation of Solution
Given:
| Extracurricular activities (hours per week) | |||
| <2 | 2 to 12 | >12 | |
| C or better | 11 | 68 | 3 |
| D or F | 9 | 23 | 5 |
Calculation:
| Extracurricular activities (hours per week) | ||||
| <2 | 2 to 12 | >12 | Total | |
| C or better | 11 | 68 | 3 | 82 |
| D or F | 9 | 23 | 5 | 37 |
| Total | 20 | 91 | 8 | 119 |
Percents that explain the nature of the relationship between performance and time
| <2 | 2 to 12 | >12 | ||
| C or better | Observed | 11 | 68 | 3 |
| % of column | 55.0% | 74.7% | 37.5% | |
| D or F | Observed | 9 | 23 | 5 |
| % of column | 45.0% | 25.3% | 62.5% |
(b)
To construct: the graph which shows these percents graphically and brief summary.
(b)
Explanation of Solution

Graph:
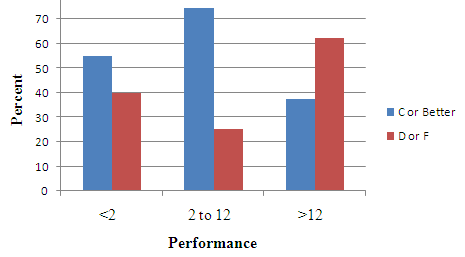
Seeing from the graph less than 2 hours of extracurricular activities about 50% of then would have earned a C or better. 2 to 12 hours of extracurricular activities, the majority would receive a C or better and more than 12 hours of extracurricular activities, the majority would receive a D or F which is looking forth.
Chapter 10 Solutions
Statistics Through Applications
Additional Math Textbook Solutions
Statistical Reasoning for Everyday Life (5th Edition)
Introductory Statistics
Statistics for Business and Economics (13th Edition)
Elementary Statistics: Picturing the World (7th Edition)


 MATLAB: An Introduction with ApplicationsStatisticsISBN:9781119256830Author:Amos GilatPublisher:John Wiley & Sons Inc
 Probability and Statistics for Engineering and th...StatisticsISBN:9781305251809Author:Jay L. DevorePublisher:Cengage Learning
 Statistics for The Behavioral Sciences (MindTap C...StatisticsISBN:9781305504912Author:Frederick J Gravetter, Larry B. WallnauPublisher:Cengage Learning
 Elementary Statistics: Picturing the World (7th E...StatisticsISBN:9780134683416Author:Ron Larson, Betsy FarberPublisher:PEARSON
 The Basic Practice of StatisticsStatisticsISBN:9781319042578Author:David S. Moore, William I. Notz, Michael A. FlignerPublisher:W. H. Freeman
 Introduction to the Practice of StatisticsStatisticsISBN:9781319013387Author:David S. Moore, George P. McCabe, Bruce A. CraigPublisher:W. H. Freeman