
Power System Analysis and Design (MindTap Course List)
6th Edition
ISBN: 9781305632134
Author: J. Duncan Glover, Thomas Overbye, Mulukutla S. Sarma
Publisher: Cengage Learning
expand_more
expand_more
format_list_bulleted
Related questions
Question
only a, b and c please
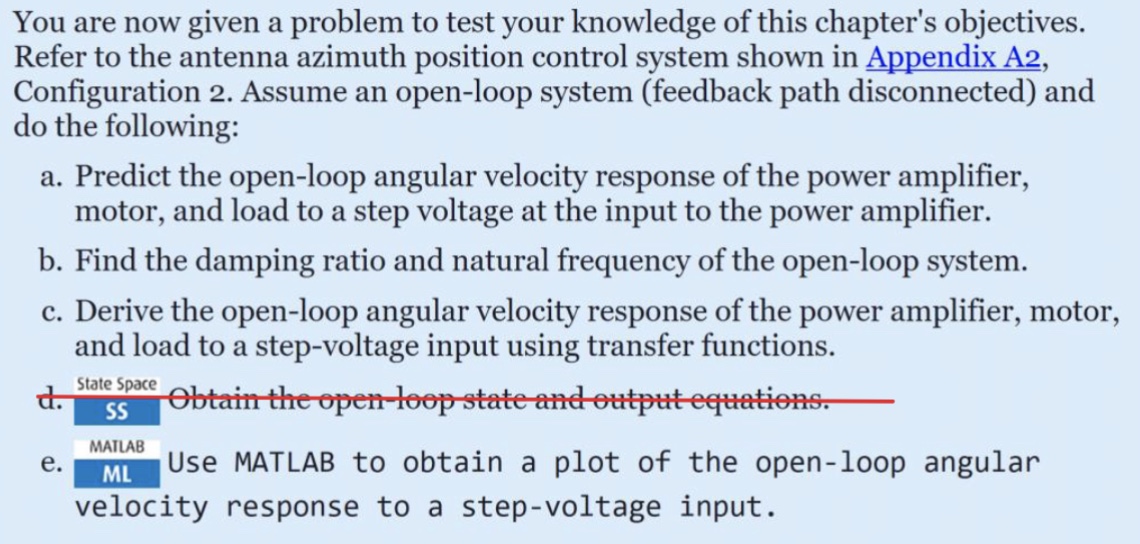

Transcribed Image Text:You are now given a problem to test your knowledge of this chapter's objectives.
Refer to the antenna azimuth position control system shown in Appendix A2,
Configuration 2. Assume an open-loop system (feedback path disconnected) and
do the following:
a. Predict the open-loop angular velocity response of the power amplifier,
motor, and load to a step voltage at the input to the power amplifier.
b. Find the damping ratio and natural frequency of the open-loop system.
c. Derive the open-loop angular velocity response of the power amplifier, motor,
and load to a step-voltage input using transfer functions.
d.
e.
State Space
SS
MATLAB
ML
Obtain the open-loop state and output equations.
Use MATLAB to obtain a plot of the open-loop angular
velocity response to a step-voltage input.
Expert Solution
This question has been solved!
Explore an expertly crafted, step-by-step solution for a thorough understanding of key concepts.

Step by stepSolved in 2 steps

Knowledge Booster

Similar questions
- Draw the circuit diagram of a Transformer Coupled Push Pull Amplifier. Explain its working taking a sinusoidal signal as the input.arrow_forwardThe block diagram representation of a tachometer feedback speed control system is shown in Figure 4. R(s) + 15.5 C(s) s+1 Tachometer Ko Figure 4 (i). Develop the closed loop transfer function. (ii). Evaluate the value of DC gain K and the time constant T with the assumption of tachometer feedback variable Ko. (ii). The system step response is represented by y = K(1 – e), sketch the step response curve for the system when the tachometer feedback variable Ko. (iv). Write a general MATLAB codes to reduce the block diagram into a single feedback control system, to calculate transfer function and to obtain unit step response and impulse response. (v). Comment on the step response curve which is obtained in (i) and (iv) with respect to K and time constant T. ko=2 k1=2.2 Note: Refer the Table for Ko and K, values.arrow_forwardGive examples for one open-loop system and one closed-loop system. Describe the system’s input, output and feedback if it is a closed-loop system.arrow_forward
- Hybrid vehicle. FIGURE P1 shows the block diagram of a possible cascade control scheme for an HEV driven by a dc motor (Preitl, 2007). The block diagram of the speed control of an HEV taken from FIGURE P1, and rearranged as a unity feedback system is shown in FIGURE P2. Here the system output is C(s) = Kss V(s), the output voltage of the speed sensor/transducer. pC, Av,- Speed K, Gre(s) controller command Torque Amplifier controller output & power voltage amplifier Acro- Motive dynamie Armature Speed |drag torque Angular speed, Ref. circuit Armature torque Vehicle signal R,(s). error U(s) T(s)T,(s) current E,(s) speed, V(s) Gse(s) K, Grc(s) R. tot Friction Feedback speed signal Kss2(s) Feedback torque current signal Kes I(S) T,(s) E,(s) Back emf D=k ks Current sensor sensitivity Kcs Speed sensor sensitivity Kss FIGURE P1 Hybrid Vehicle R (s), E (s) Uc(s) |C(s) + Gsc(s) 0.11 (s + 0.6) SC s (s + 0.5173) + 5 (s + 0.6) (s + 0.01908) URE P2 Block diagram of the speed control of an HEV a.…arrow_forward7&8arrow_forward7. a) Sketch the root locus of the feedback control system represented by the block diagram in Figure Q.7 for the range: 0 s Ks0. Show the calculations for, and mark clearly on the diagram, the following features: i) the values of the open loop poles and zeros, ii) the intersection point and angle of the asymptotes, iii) the breakaway point iv) the points at which the locus crosses the imaginary axis. b) What is the range of K for the system to be stable? c) At what value of K does the system response become oscillatory? R(s) 20 C(s) s(s +9) K Figure Q.7arrow_forward
- control system Consider the total harmonic distortion of a closed loop system is 5%. Distortion without feedback is 10%. Calculate the sensitivity of the closed loop system.arrow_forwardpls answer #8arrow_forwardWhat are the advantages and disadvantages of a transformer-coupled load class B push-pull amplifier?arrow_forward
arrow_back_ios
SEE MORE QUESTIONS
arrow_forward_ios
Recommended textbooks for you
- Power System Analysis and Design (MindTap Course ...Electrical EngineeringISBN:9781305632134Author:J. Duncan Glover, Thomas Overbye, Mulukutla S. SarmaPublisher:Cengage Learning
Power System Analysis and Design (MindTap Course ...
Electrical Engineering
ISBN:9781305632134
Author:J. Duncan Glover, Thomas Overbye, Mulukutla S. Sarma
Publisher:Cengage Learning