FINANCIAL ACCOUNTING
10th Edition
ISBN: 9781259964947
Author: Libby
Publisher: MCG
expand_more
expand_more
format_list_bulleted
Question
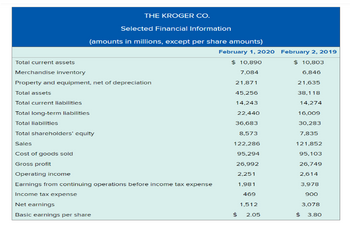
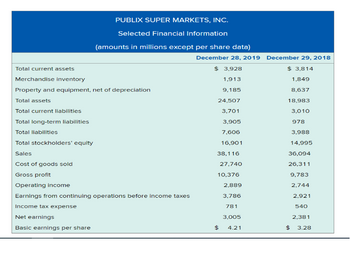
a. Compute the following ratios for the companies’ most recent fiscal years: [Note – some
amounts are different from the printed text version]. EXCEL MUST BE USED FOR
CALCULATIONS USING THE EXCEL TEMPLATE PROVIDED IN CANVAS. IT IS
IMPORTANT THAT I BE ABLE TO SEE YOUR WORK.
(1)Current ratio .
(2) Average days to sell inventory. (Use average inventory.)
(3) Debt to assets ratio.
(4) Return on investment. (Use average assets and use “earnings from continuing operations”
rather than “net earnings.”)
(5) Gross margin percentage.
(6) Asset turnover. (Use average assets.)
(7) Net margin. (Use “earnings from continuing operations” rather than “net earnings.”)
(8) Plant assets to long-term debt ratio.
b. Which company appears to be more profitable? Explain your answer and identify which ratio(s)
from Requirement a you used to reach your conclusion.
c. Which company appears to have the higher level of financial risk? Explain your answer and
identify which ratio(s) from Requirement a you used to reach your conclusion.
d. Which company appears to be charging higher prices for its goods? Explain your answer and
identify which ratio(s) from Requirement a you used to reach your conclusion.
e. Which company appears to be the more efficient at using its assets? Explain your answer and
identify which ratio(s) from Requirement a you used to reach your conclusion.
amounts are different from the printed text version]. EXCEL MUST BE USED FOR
CALCULATIONS USING THE EXCEL TEMPLATE PROVIDED IN CANVAS. IT IS
IMPORTANT THAT I BE ABLE TO SEE YOUR WORK.
(1)
(2) Average days to sell inventory. (Use average inventory.)
(3) Debt to assets ratio.
(4) Return on investment. (Use average assets and use “earnings from continuing operations”
rather than “net earnings.”)
(5) Gross margin percentage.
(6) Asset turnover. (Use average assets.)
(7) Net margin. (Use “earnings from continuing operations” rather than “net earnings.”)
(8) Plant assets to long-term debt ratio.
b. Which company appears to be more profitable? Explain your answer and identify which ratio(s)
from Requirement a you used to reach your conclusion.
c. Which company appears to have the higher level of financial risk? Explain your answer and
identify which ratio(s) from Requirement a you used to reach your conclusion.
d. Which company appears to be charging higher prices for its goods? Explain your answer and
identify which ratio(s) from Requirement a you used to reach your conclusion.
e. Which company appears to be the more efficient at using its assets? Explain your answer and
identify which ratio(s) from Requirement a you used to reach your conclusion.

Transcribed Image Text:THE KROGER CO.
Selected Financial Information
(amounts in millions, except per share amounts)
February 1, 2020
Total current assets
Merchandise inventory
Property and equipment, net of depreciation
Total assets
Total current liabilities
Total long-term liabilities
$ 10,890
7,084
February 2, 2019
$ 10,803
6,846
21,871
21,635
45,256
38,118
14,243
14,274
22,440
16,009
Total liabilities
36,683
30,283
Total shareholders' equity
8,573
7,835
Sales
122,286
121,852
Cost of goods sold
95,294
95,103
Gross profit
26,992
26,749
Operating income
2,251
2,614
Earnings from continuing operations before income tax expense
1,981
3,978
Income tax expense
469
900
Net earnings
1,512
3,078
Basic earnings per share
$
2.05
$
3.80

Transcribed Image Text:PUBLIX SUPER MARKETS, INC.
Selected Financial Information
(amounts in millions except per share data)
Total current assets
Merchandise inventory
Property and equipment, net of depreciation
Total assets
Total current liabilities
Total long-term liabilities
Total liabilities
Total stockholders' equity
Sales
Cost of goods sold
Gross profit
Operating income
Earnings from continuing operations before income taxes
Income tax expense
Net earnings
Basic earnings per share
December 28, 2019 December 29, 2018
$ 3,928
$ 3,814
1,913
1,849
9,185
8,637
24,507
18,983
3,701
3,010
3,905
978
7,606
3,988
16,901
14,995
38,116
36,094
27,740
26,311
10,376
9,783
2,889
2,744
3,786
2,921
781
540
3,005
2,381
$
4.21
$
3.28
Expert Solution
This question has been solved!
Explore an expertly crafted, step-by-step solution for a thorough understanding of key concepts.
Step by stepSolved in 2 steps

Knowledge Booster
Similar questions
- Consolidated Statements of Operations FINANCIAL STATEMENTS Table of Contents Index to Financial Statements (millions, except per share data) 2020 2019 2018 Sales Other revenue $ 92,400 $ 77,130 $ 74,433 1,161 982 923 Total revenue 93,561 78,112 75,356 Cost of sales 66,177 54,864 53,299 Selling, general and administrative expenses 18,615 16,233 15,723 Depreciation and amortization (exclusive of depreciation included in cost of sales) 2,230 2,357 2,224 Operating income 6,539 4,658 4,110 Net interest expense 977 477 461 Net other (income) / expense 16 (9) (27) Earnings from continuing operations before income taxes 5,546 4,190 3,676 Provision for income taxes 1,178 921 746 Net earnings from continuing operations 4,368 3,269 2,930 Discontinued operations, net of tax 12 7 Net earnings $ 4,368 $ 3,281 $ 2,937 Basic earnings per share Continuing operations Discontinued operations Net earnings per share Diluted earnings per share Continuing operations Discontinued operations $ 8.72 $ 6.39 $…arrow_forwardHelp me answer this A. Marketable securities for general aviation inc for 2020 B. Accounts receivable for general aviation inc for 2020 C.Inventory for general aviation inc for 2020arrow_forward23. Condensed financial data of Novak Company for 2020 and 2019 are presented below. NOVAK COMPANYCOMPARATIVE BALANCE SHEETAS OF DECEMBER 31, 2020 AND 2019 2020 2019 Cash $1,830 $1,180 Receivables 1,710 1,320 Inventory 1,590 1,920 Plant assets 1,890 1,710 Accumulated depreciation (1,220 ) (1,190 ) Long-term investments (held-to-maturity) 1,320 1,440 $7,120 $6,380 Accounts payable $1,190 $890 Accrued liabilities 210 260 Bonds payable 1,400 1,580 Common stock 1,940 1,660 Retained earnings 2,380 1,990 $7,120 $6,380 NOVAK COMPANYINCOME STATEMENTFOR THE YEAR ENDED DECEMBER 31, 2020 Sales revenue $6,720 Cost of goods sold 4,680 Gross margin 2,040 Selling and administrative expenses 920 Income from operations…arrow_forward
- Avery Corporation Balance Sheet For year ending December 31 2019 2020 2021 ssets Cash & securities 17,643.813 132,468.629 22,281.616 115,121.68 27,594.924 ccounts receivable 112,479.309 100,955.129 10,947.986 251,977.349 ventories 78,867.845 90,512.493 10,222.209 239,202.497 repaid expenses 10,426.653 otal current assets 238,342.442 Flant property and equipment Lcumulated depreciation let property plant and equipment 531,554.881 510,906.018 536,451.319 87,197.29 128,069.772 170,985.877 444,357.591 382,836.246 365,465.442 Other assets 10,222.209 15,639.98 16,421.979 otal Assets 693,782.297 636,818.669 633,864.769 iabilities & Shareholders'Equity ccounts payable ank Loan axes Payable ccrued expenses 54,080.808 31,297.644 27,599.965 45,191.687 112,482.797 26,066.634 15,639.98 37,773.252 150,798.301 27,369.965 26,577.744 139,556.161 32,843.958 248,785.476 otal current liabilities 199,381.098 ong term debt 95,000 55,000 30,000 Common stock 300,000 200,000 150,000 Eetained earnings Total…arrow_forwardNet Sales COGS Depreciation EBIT Interest Taxable Income Taxes Net Income 2019 Income Statement Dividends Additions to Retained Earnings 147 647.74 3,456 1,895 235 1,326 320 1,006 211.26 794.74arrow_forwardSandhill Co. reported the following information for 2020: Sales revenue $2520000 Cost of goods sold 1748000 Operating expenses 282000 Unrealized holding gain on available-for-sale securities 85700 Cash dividends received on the securities 9200 For 2020, Sandhill would report comprehensive income of A.$85700. B.$499200. C.$575700. D.$584900.arrow_forward
- What is Ratio Corporation's Fiscal 2021 Times Interest Earned Ratio? 1.41 2.57 4.5 1.63arrow_forwardCOMPARATIVE BALANCE SHEET S OF DECEMBER 31,2020 AND 2019 $1,800 1,750 1,600 $1,150 1,300 1,000 1,700 (1,170) 1,420 Cash Recetvables Inventory Plant assets (1,200 ) 1,300 $7,150 Accumulated depreclatlon Long-term Investments (held-to-maturity) $6,300 Accounts payable Accrued llabilitles 200 250 Bonds payable 1,400 1,550 Common stock 1,700 Retained eamings 2,450 $7,150 $6,300 PAT METHENY COMPANY INCOME STATEMENT FOR THE YEAR ENDED DECEMBER 31, 2020 $5,900 4,200 sales revEnue Pjos spoo6 jo j50 Selling and administrative expenses Income fron operations 930 1,270 Other revenues and gains Gain on sale of Investrments Income befare tax 1,350 Income tax expense 540 Net incoE Cash dy deds 266 Income retained In business Add tional information:arrow_forwardThe comparative balance sheets for Metlock Corporation show the following information. December 312020 2019Cash $33,500 $12,900Accounts receivable 12,400 10,000Inventory 12,100 9,000Available-for-sale debt investments –0– 3,000Buildings –0– 29,800Equipment 44,800 19,900Patents 5,000 6,300 $107,800 $90,900Allowance for doubtful accounts $3,100 $4,500Accumulated depreciation—equipment 2,000 4,500Accumulated depreciation—building –0– 6,000Accounts payable 5,000 3,000Dividends payable –0– 4,900Notes payable, short-term (nontrade) 3,000 4,100Long-term notes payable 31,000 25,000Common stock 43,000 33,000Retained earnings 20,700 5,900 $107,800 $90,900 Additional data related to 2020 are as follows. 1. Equipment that had cost $11,000 and was 40% depreciated at time of disposal was sold for $2,500.2. $10,000 of the long-term note payable was paid by issuing common stock.3. Cash dividends paid were $4,900.4. On January…arrow_forward
- Assets Current assets Net fixed assets INCOME STATEMENT, 2022 (Figures in $ millions) Revenue Cost of goods sold Depreciation Interest expense 2021 $ 101 2022 $ 195 910 1,010 $ 2,005 1,085 405 251 Req A and B Req C and D BALANCE SHEET AT END OF YEAR (Figures in $ millions) Liabilities and Shareholders' Equity Current liabilities Long-term debt Req E Complete this question by entering your answers in the tabs below. a&b. What is shareholders' equity in 2021 and 2022? c&d. What is net working capital in 2021 and 2022? e. What are taxes paid in 2022? Assume the firm pays taxes equal to 21% of taxable income. f. What is cash provided by operations during 2022? g.Net fixed assets increased from $910 million to $1,010 million during 2022. What must have been South Sea's gross investment in fixed assets during 2022? Answer is complete but not entirely correct. h. If South Sea reduced its outstanding accounts payable by $46 million during the year, what must have happened to its other current…arrow_forwardCondensed financial data of Martinez Company for 2020 and 2019 are presented below. MARTINEZ COMPANYCOMPARATIVE BALANCE SHEETAS OF DECEMBER 31, 2020 AND 2019 2020 2019 Cash $1,780 $1,130 Receivables 1,740 1,290 Inventory 1,610 1,870 Plant assets 1,930 1,710 Accumulated depreciation (1,210 ) (1,150 ) Long-term investments (held-to-maturity) 1,290 1,440 $7,140 $6,290 Accounts payable $1,180 $900 Accrued liabilities 190 240 Bonds payable 1,410 1,590 Common stock 1,920 1,690 Retained earnings 2,440 1,870 $7,140 $6,290 MARTINEZ COMPANYINCOME STATEMENTFOR THE YEAR ENDED DECEMBER 31, 2020 Sales revenue $6,880 Cost of goods sold 4,650 Gross margin 2,230 Selling and administrative expenses 940 Income from…arrow_forwardBHP Group Ltd.- 2019 and 2020 Partial Balance Sheet Assets Liabilities & Owner’s Equity 2019 2020 2019 2020 Current assets $4665 $7279 Current liabilities $2076 $4256 Net Fixed assets $7033 $11378 Long-term debt $3712 $1980 Total Equity (Total assets – total liabilities) (Total assets – total liabilities) BHP Group Ltd.- 2020 Income Statement Sales $10073 Cost of goods sold $5815 Depreciation $2227 Interest paid $1284 Taxes $1202 Calculate the Profit margin ratio of BHP Group Ltd. for the financial year 2020arrow_forward
arrow_back_ios
SEE MORE QUESTIONS
arrow_forward_ios
Recommended textbooks for you

 AccountingAccountingISBN:9781337272094Author:WARREN, Carl S., Reeve, James M., Duchac, Jonathan E.Publisher:Cengage Learning,
 Accounting Information SystemsAccountingISBN:9781337619202Author:Hall, James A.Publisher:Cengage Learning,
 Horngren's Cost Accounting: A Managerial Emphasis...AccountingISBN:9780134475585Author:Srikant M. Datar, Madhav V. RajanPublisher:PEARSON
 Intermediate AccountingAccountingISBN:9781259722660Author:J. David Spiceland, Mark W. Nelson, Wayne M ThomasPublisher:McGraw-Hill Education
 Financial and Managerial AccountingAccountingISBN:9781259726705Author:John J Wild, Ken W. Shaw, Barbara Chiappetta Fundamental Accounting PrinciplesPublisher:McGraw-Hill Education


Accounting
Accounting
ISBN:9781337272094
Author:WARREN, Carl S., Reeve, James M., Duchac, Jonathan E.
Publisher:Cengage Learning,

Accounting Information Systems
Accounting
ISBN:9781337619202
Author:Hall, James A.
Publisher:Cengage Learning,

Horngren's Cost Accounting: A Managerial Emphasis...
Accounting
ISBN:9780134475585
Author:Srikant M. Datar, Madhav V. Rajan
Publisher:PEARSON

Intermediate Accounting
Accounting
ISBN:9781259722660
Author:J. David Spiceland, Mark W. Nelson, Wayne M Thomas
Publisher:McGraw-Hill Education

Financial and Managerial Accounting
Accounting
ISBN:9781259726705
Author:John J Wild, Ken W. Shaw, Barbara Chiappetta Fundamental Accounting Principles
Publisher:McGraw-Hill Education