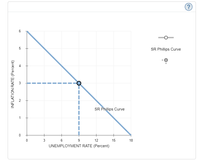
The following graph shows the current short-run
Suppose the central bank of the hypothetical economy decides to increase the money supply.
1. On the following graph, shift the curve or drag the blue point along the curve, or do both, to show the short-run effects of this policy. (Please use the image attached)
2. In the short run, an unexpected increase in the money supply results in a decrease? an increase? no change? in the inflation rate and a decrease? an increase? no change? in the unemployment rate.

Trending nowThis is a popular solution!
Step by stepSolved in 3 steps with 1 images

- Note:Hand written solution is not accepted.arrow_forward8. Problems and Applications Q8 As described in the chapter, the Federal Reserve in 2008 faced a decrease in aggregate demand caused by the housing and financial crises and a decrease in short-run aggregate supply caused by rising commodity prices. Starting from a long-run equilibrium, illustrate the effects of these two changes on aggregate supply and aggregate demand on the following graph. Then on the subsequent graph, indicate what happens in a Phillips-curve diagram. Price Level LRAS Aggregate Supply * Aggregate Demand Quantity of Output Aggregate Demand Aggregate Supply LRAS Long-Run Equilibrium (?)arrow_forwardNote :Don't use chat botarrow_forward
- Question 7 Which of the following are true about real and nominal demand? There may be more than one answer. a) A rise in the demand for real balances (Ma/P) raises equilibrium prices in the short-run. b) A drop in the demand for nominal balances (Ma) reduces equilibrium prices in the long-run. c) A change in government purchases can affect aggregate demand in the long-run. d) A change in government purchases can affect aggregate demand in the short-run.arrow_forwardEconomics Options for the first 3 blanks (increase, derease, no change,) Option for last: rational expectations theory, monetarism, keynesian theoryarrow_forwardThe graph shows Iran's short-run Phillips curve and long-run Phillips curve when the natural unemployment rate is 10 percent and the expected inflation rate is 12 percent a year. Draw a point to show the current unemployment rate and inflation rate according to the news clip. Suppose Iran removes the subsidies and consumers don't know what the higher prices will be. Illustrate the most likely path of unemployment and inflation. Draw either an arrow along the SRPC showing the direction of change, or a new SRPC. Label it 1. Suppose instead that Iran removes the subsidies and announces the new prices so that consumers know what they are. Illustrate the most likely path of inflation and unemployment. Draw either an arrow along the SRPC showing the direction of change, or a new SRPC Label it 2. ILSarrow_forward
- The following graph depicts the short-run and long-run Phillips curves (SRPC and LRPC) for a hypothetical economy in long-run macroeconomic equilibrium at point A, where the natural unemployment rate is 6% and the current inflation rate is 8% per year.arrow_forwardAnswer the given question with a proper explanation and step-by-step solution.arrow_forwardHow does the modern view of the Phillips curve differ from the earlier view? ___The early view of the Phillips curve suggested that the Phillips curve shifts with changes in inflation expectations. Such a view failed to recognize that the Phillips curve is a fixed inverse relationship between inflation and unemployment. ___The early view of the Phillips curve suggested that the Phillips curve is fixed, with higher rates of inflation associated with lower rates of unemployment, and vice versa. Such a view failed to recognize the importance of inflation expectations in determining the position of the short-run Phillips curve. Note:- Do not provide handwritten solution. Maintain accuracy and quality in your answer. Take care of plagiarism. Answer completely. You will get up vote for sure.arrow_forward
- Inflation rate Phillips curve, Phillips curveo Unemployment rate In the given graph of the Phillips curve, which of the following would have caused the Phillips curve to shift as shown? Conducting contractionary monetary policy when the economy is at its short-run equilibrium. Conducting expansionary monetary policy when the economy is at its short-run equilibrium. Conducting contractionary monetary policy when the economy is at its long-run equilibrium. 1 Conducting expansionary monetary policy when the economy is at its long-run equilibrium.arrow_forwardI need help with this question with explanation.arrow_forwardThere’s a change in Federal Reserve policy regarding the growth of the money supply. What if the markets do not believe in the policy?arrow_forward

 Principles of Economics (12th Edition)EconomicsISBN:9780134078779Author:Karl E. Case, Ray C. Fair, Sharon E. OsterPublisher:PEARSON
 Engineering Economy (17th Edition)EconomicsISBN:9780134870069Author:William G. Sullivan, Elin M. Wicks, C. Patrick KoellingPublisher:PEARSON
 Principles of Economics (MindTap Course List)EconomicsISBN:9781305585126Author:N. Gregory MankiwPublisher:Cengage Learning
 Managerial Economics: A Problem Solving ApproachEconomicsISBN:9781337106665Author:Luke M. Froeb, Brian T. McCann, Michael R. Ward, Mike ShorPublisher:Cengage Learning
 Managerial Economics & Business Strategy (Mcgraw-...EconomicsISBN:9781259290619Author:Michael Baye, Jeff PrincePublisher:McGraw-Hill Education


