ENGR.ECONOMIC ANALYSIS
14th Edition
ISBN: 9780190931919
Author: NEWNAN
Publisher: Oxford University Press
expand_more
expand_more
format_list_bulleted
Question

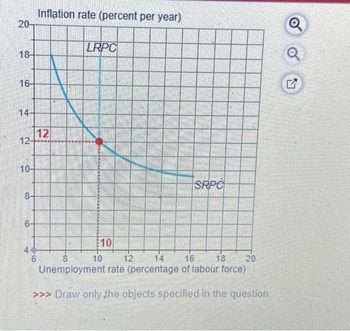
Transcribed Image Text:20-
18-
16-
14-
124
10-
8-
6-
ST
Inflation rate (percent per year)
6
12
LRPC
10
8
12
14
16
18
20
Unemployment rate (percentage of labour force)
>>> Draw only the objects specified in the question.
SRPC
10
G

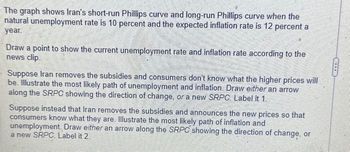
Transcribed Image Text:The graph shows Iran's short-run Phillips curve and long-run Phillips curve when the
natural unemployment rate is 10 percent and the expected inflation rate is 12 percent a
year.
Draw a point to show the current unemployment rate and inflation rate according to the
news clip.
Suppose Iran removes the subsidies and consumers don't know what the higher prices will
be. Illustrate the most likely path of unemployment and inflation. Draw either an arrow
along the SRPC showing the direction of change, or a new SRPC. Label it 1.
Suppose instead that Iran removes the subsidies and announces the new prices so that
consumers know what they are. Illustrate the most likely path of inflation and
unemployment. Draw either an arrow along the SRPC showing the direction of change, or
a new SRPC Label it 2.
ILS
Expert Solution
This question has been solved!
Explore an expertly crafted, step-by-step solution for a thorough understanding of key concepts.
Step by stepSolved in 3 steps with 2 images

Knowledge Booster
Learn more about
Need a deep-dive on the concept behind this application? Look no further. Learn more about this topic, economics and related others by exploring similar questions and additional content below.Similar questions
- Assume the inflation rate as measured by the CPI is 3.9% and the inflation rate as measured by the core CPI is 2.3% What would explain the difference between the two? Which would you argue that policy makers would be more likely to pay attention to and why?arrow_forwardI need help soon as possible please. I only have one hour to finish.arrow_forward1. Aggregate demand, aggregate supply, and the Phillips curve In the year 2027, aggregate demand and aggregate supply in the imaginary country of Aso-Kuju are represented by the curves AD2027 and AS on the following graph. The price level is currently 102. The graph also shows two potential outcomes for 2028. The first possible aggregate demand curve is given by the curve labeled ADA curve, resulting in the outcome given by point A. The second possible aggregate demand curve is given by the curve labeled ADB, resulting in the outcome given by point B. PRICE LEVEL 108 107 106 105 104 103 102 101 100 0 AD 2027 2 4 B AS ADB ADA 8 10 6 OUTPUT (Trillions of dollars) 12 14 16 (?) Suppose the unemployment rate is 7% under one of these two outcomes and 5% under the other. Based on the previous graph, you would expect outcome B▼ to be associated with the lower unemployment rate (5%). If aggregate demand is high in 2028, and the economy is at outcome B, the inflation rate between 2027 and 2028…arrow_forward
- In the year 2020, aggregate demand and aggregate supply in the fictional country of Drooble are represented by the curves AD2020 and AS on the following graph. The price level is 102. The graph also shows two possible outcomes for 2021. The first potential aggregate demand curve is given by the ADA curve, resulting in the outcome illustrated by point A. The second potential aggregate demand curve is given by the ADB curve, resulting in the outcome illustrated by point B. PRICE LEVEL 108 107 B 106 105 104 103 AD 2020 102 101 100 0 2 4 6 8 A 10 OUTPUT (Trillions of dollars) AS AD A ADB 12 14 16 ? Suppose the unemployment rate is 5% under one of these two outcomes and 2% under the other. Based on the previous graph, you would expect to be associated with the higher unemployment rate (5%). If aggregate demand is low in 2021, and the economy is at outcome A, the inflation rate between 2020 and 2021 isarrow_forwardAverage inflation went up by 65.5% since the turn of the century while college tuition and fees soared by 175%. Why has the relative price of college increased so much compared to average inflation?arrow_forwardAnswer the given question with a proper explanation and step-by-step solution.arrow_forward
- 1. An economy has the following equation for the Phillips Curve: π = Eπ − 0.5(u − 6)People form expectations of inflation by taking a weighted average of the previous two years of inflation: Okun’s law for this economy is: Eπ = 0.7π−1 + 0.3π−2 (Y −Y−1)/(Y-1)=3.0−2.0(u−u−1) Th economy begins at its natural rate of unemployment with a stable inflation rate of 5 percent. Graph the short-run tradeoff between inflation and unemployment that this economy faces. Label the point where the economy begins as A. (Be sure to give numerical values for point A.) A fall in aggregate demand leads to a recession, causing the unemployment rate to rise 4 percentage points above its natural rate. On your graph in part (b), label the point the economy experiences that year as point B.(Be sure to give numerical values.) Unemployment remains at this high level for two years (the initial year described in part (c) and one more), after which it returns to its natural rate. Create a table showing…arrow_forwardIt has been argued that inflation and unemployment are both good and bad. Explain. Are government efforts to control inflation and brings unemployment to Zero well advised? Explain. Please put the website linkarrow_forwardThere’s a change in Federal Reserve policy regarding the growth of the money supply. What if the markets do not believe in the policy?arrow_forward
- The following graphs show the state of an economy that is currently in long-run equilibrium. The first graph shows the aggregate demand (AD) and long-run aggregate supply (LRAS) curves. The second shows the long-run and short-run Phillips curves (LRPC and SRPC). PRICE LEVEL INFLATION RATE 0 3 LRAS 4 5 LRPC 9 AD O AD LRAS 6 12 UNEMPLOYMENT RATE (Percent) 15 SRPC 18 Ⓒ SRPC - LRPCarrow_forwardPhillips Curve - This graph shows the inverse relationship between inflation and unemployment in the economy. It is used to illustrate the trade-off between inflation and unemployment and to help policymakers decide on appropriate policy responses. show this graph with an example.arrow_forwardThe graph depicts a hypothetical economy's short-run Philips curve (SRPC). Please shift the SRPC to reflect what happens when expected inflation decreases by 2 percentage points. After the shift in SRPC, what is the unemployment rate if the public expects no inflation in the economy? % Inflation rate (%) -1 -2 0 7 6 SRPC 5 4 3 2 -3 0 1 2 3 4 5 6 7 8 0 10arrow_forward
arrow_back_ios
SEE MORE QUESTIONS
arrow_forward_ios
Recommended textbooks for you

 Principles of Economics (12th Edition)EconomicsISBN:9780134078779Author:Karl E. Case, Ray C. Fair, Sharon E. OsterPublisher:PEARSON
 Engineering Economy (17th Edition)EconomicsISBN:9780134870069Author:William G. Sullivan, Elin M. Wicks, C. Patrick KoellingPublisher:PEARSON
 Principles of Economics (MindTap Course List)EconomicsISBN:9781305585126Author:N. Gregory MankiwPublisher:Cengage Learning
 Managerial Economics: A Problem Solving ApproachEconomicsISBN:9781337106665Author:Luke M. Froeb, Brian T. McCann, Michael R. Ward, Mike ShorPublisher:Cengage Learning
 Managerial Economics & Business Strategy (Mcgraw-...EconomicsISBN:9781259290619Author:Michael Baye, Jeff PrincePublisher:McGraw-Hill Education


Principles of Economics (12th Edition)
Economics
ISBN:9780134078779
Author:Karl E. Case, Ray C. Fair, Sharon E. Oster
Publisher:PEARSON

Engineering Economy (17th Edition)
Economics
ISBN:9780134870069
Author:William G. Sullivan, Elin M. Wicks, C. Patrick Koelling
Publisher:PEARSON

Principles of Economics (MindTap Course List)
Economics
ISBN:9781305585126
Author:N. Gregory Mankiw
Publisher:Cengage Learning

Managerial Economics: A Problem Solving Approach
Economics
ISBN:9781337106665
Author:Luke M. Froeb, Brian T. McCann, Michael R. Ward, Mike Shor
Publisher:Cengage Learning

Managerial Economics & Business Strategy (Mcgraw-...
Economics
ISBN:9781259290619
Author:Michael Baye, Jeff Prince
Publisher:McGraw-Hill Education