ENGR.ECONOMIC ANALYSIS
14th Edition
ISBN: 9780190931919
Author: NEWNAN
Publisher: Oxford University Press
expand_more
expand_more
format_list_bulleted
Question
Answer the given question with a proper explanation and step-by-step solution.

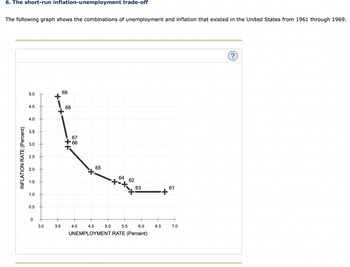
Transcribed Image Text:6. The short-run inflation-unemployment trade-off
The following graph shows the combinations of unemployment and inflation that existed in the United States from 1961 through 1969.
INFLATION RATE (Percent)
5.0
4.5
4.0
3.5
3.0
2.5
2.0
1.5
1.0
0.5
0
3.0
3.5
69
68
67
66
4.0
65
+
64 62
63
4.5
5.0 5.5
6.0
UNEMPLOYMENT RATE (Percent)
+
6.5
61
7.0
?

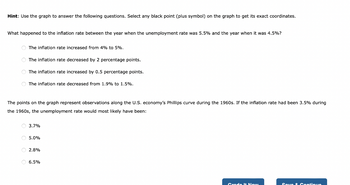
Transcribed Image Text:Hint: Use the graph to answer the following questions. Select any black point (plus symbol) on the graph to get its exact coordinates.
What happened to the inflation rate between the year when the unemployment rate was 5.5% and the year when it was 4.5%?
The inflation rate increased from 4% to 5%.
The inflation rate decreased by 2 percentage points.
The inflation rate increased by 0.5 percentage points.
The inflation rate decreased from 1.9% to 1.5%.
The points on the graph represent observations along the U.S. economy's Phillips curve during the 1960s. If the inflation rate had been 3.5% during
the 1960s, the unemployment rate would most likely have been:
3.7%
O 5.0%
○ 2.8%
O 6.5%
Credo It Now
Sove & Continue
Expert Solution
This question has been solved!
Explore an expertly crafted, step-by-step solution for a thorough understanding of key concepts.
This is a popular solution
Trending nowThis is a popular solution!
Step by stepSolved in 4 steps with 1 images

Knowledge Booster
Learn more about
Need a deep-dive on the concept behind this application? Look no further. Learn more about this topic, economics and related others by exploring similar questions and additional content below.Similar questions
- Fast-and-frugal heuristics fit within the theory of bounded rationality. True Falsearrow_forwardWhat’s Wrong with Economics: A Discussion Between Paul Krugman and Jeff Madrick. (2015). Challenge (05775132), 58(2), 112–134. · Cochrane, J. H. (2011). How Did Paul Krugman Get It so Wrong? Economic Affairs, 31(2), 36–40. You are expected to critically evaluate the three articles provided, identify themes and gaps, then synthesize what you have learned, keeping in mind Krugman’s economic impact. The paper should be a minimum of 1500 words in APA format.arrow_forwardWhat are the general philosophies of any two of the following famous economists? Is it possible to get help understanding why they are so significant? John Maynard Keynes, Milton Friedman, Adam Smith, Karl Marx, John Stuart Mills, Friedrich Hayek.arrow_forward
- The illusion of pattern shapes our everyday lives. How does this illusion emerge (refer to law of small numbers & impossibility of causal explanations) and how does it affect decision-making?arrow_forwardIn a minimum of 250 words, explain what the three core economic questions are that every society has to answer and then discuss how the U.S. addresses these. Then, provide a brief description of the U.S. economy. If desired, you can compare and contrast this with how another country (or other countries) addresses these questions. Ensure that you use facts to support your points and provide citations and references for those sources. The required text is chapters 1-3 in Schiller, B. R., & Gebhardt, K. (2016). The economy today (14th ed.). Columbus, OH: McGraw-HillHigher Education (ISBN:9780078021862).arrow_forwardThe primary focus of energy economics is how: Group of answer choices a-Energy production is decreasing b-People deal with the scarcity of energy c-People conserve crude oil for future use d-Energy consumption is increasingarrow_forward
arrow_back_ios
arrow_forward_ios
Recommended textbooks for you

 Principles of Economics (12th Edition)EconomicsISBN:9780134078779Author:Karl E. Case, Ray C. Fair, Sharon E. OsterPublisher:PEARSON
 Engineering Economy (17th Edition)EconomicsISBN:9780134870069Author:William G. Sullivan, Elin M. Wicks, C. Patrick KoellingPublisher:PEARSON
 Principles of Economics (MindTap Course List)EconomicsISBN:9781305585126Author:N. Gregory MankiwPublisher:Cengage Learning
 Managerial Economics: A Problem Solving ApproachEconomicsISBN:9781337106665Author:Luke M. Froeb, Brian T. McCann, Michael R. Ward, Mike ShorPublisher:Cengage Learning
 Managerial Economics & Business Strategy (Mcgraw-...EconomicsISBN:9781259290619Author:Michael Baye, Jeff PrincePublisher:McGraw-Hill Education


Principles of Economics (12th Edition)
Economics
ISBN:9780134078779
Author:Karl E. Case, Ray C. Fair, Sharon E. Oster
Publisher:PEARSON

Engineering Economy (17th Edition)
Economics
ISBN:9780134870069
Author:William G. Sullivan, Elin M. Wicks, C. Patrick Koelling
Publisher:PEARSON

Principles of Economics (MindTap Course List)
Economics
ISBN:9781305585126
Author:N. Gregory Mankiw
Publisher:Cengage Learning

Managerial Economics: A Problem Solving Approach
Economics
ISBN:9781337106665
Author:Luke M. Froeb, Brian T. McCann, Michael R. Ward, Mike Shor
Publisher:Cengage Learning

Managerial Economics & Business Strategy (Mcgraw-...
Economics
ISBN:9781259290619
Author:Michael Baye, Jeff Prince
Publisher:McGraw-Hill Education