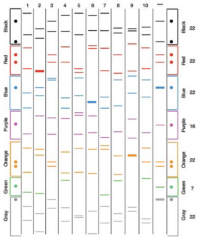
The following figure shows the FBI-style analysis of the genomic DNA of 10 people (1-10), and also of hair found at a crime scence left by the murderer [***]. This analysis involves the PCR amplification of SSR loci, each from a different (nonhomologus) chromosome. The PCR primers are for each SSR locus are labeled with a unique fluorescent molecule. Some bands are thicker because relatively more of the corresponding PCR product was obtained. The figure has dots aligned on both sides to help you find the crucial bands; it will help to use a straight-edge as a guide. The numbers at right are the total number of copies of the SSR locus among the population of 11 samples.
-
Are any of individuals 1-10 probable relatives of the murderer? If so, identify this person and describe the degree of relationship to the criminal.

Trending nowThis is a popular solution!
Step by stepSolved in 2 steps with 1 images

- Answer this question please.arrow_forwardThe current state-of-the-art in forensic DNA profiling involves the PCR-amplification and analysis ofshort tandem repeats, STRs, in the human genome. This approach has many distinct advantages.Please list and explain three of those advantages.arrow_forwardEntire sequence below needs to beamplified by PCR and subcloned into a plasmid vector. Which of the primersequences listed underneath is the correct reverse primer (6 marks)? Copy correctsequence into your answer. Why primer e) is not the right answer (4 marks)? 5'ATCTCTATTTAATATTTATGTCTATTTAAGCCTCATATTTAAAGACAGGGAAGAGCAGAACGGAGCCCCAGGCCTCTGTGTCCTTCCCTGCATTTCTGAGTTTCATTCTCCTGCCTGTAGCAGTGAGAAAAAGCTCCTGTCCTCCCATCCCCTGGACTGGGAGGTAGATAGGTAAATACCAAGTATTTATTACTATGACTGCTCCCCAGCCCTGGCTCTGCAATGGGCACTGGGATGAGCCGCTGTGAGCCCCTGGTCCTGAGGGTCCCCACCTGGGACCCTTGAGAGTATCAGGTCTCCCACGTGGGAGACAAGAAATCCCTGTTTAATATTTAAACAGCAGTGTTCCCCATCTGGGTCCTTGCACCCCTCACTCTGGCCTCAGCCGACTGCACAGCGGCCCCTGCATCCCCTTGGCTGTGAGGCCCCTGGACAAGCAGAGGTGGCCAGAGCTGGGAGGCATGGCCCTGGGGTCCCACGAATTTGCTGGGGAATCTCGTTTTTCTTCTTAAGACTTTTGGGACATGGTTTGACTCCCGAACATCACCGACGCGTCTCCTGCTG 3'a) 5' TTCCGGAAGAAGCTTATACGG 3'b) 5' CTGTGTTCACCTAATATTCCT 3'c) 5' CAGCAGGAGACGCGTCGGTGA 3'd) 5' AGGAATATTAGTATAATCCAC 3'e) 5' GACGCGTCGGTGATGTTCGGG 3’f) 5'…arrow_forward
- An individual is heterozygous for an allele. Allele A has a SNP that results in disruption of an Not1 restriction enzyme site. Allele B has a functional Not1 restriction enzyme site. PCR is performed on the region of the gene containing the SNP to produce a 255bp PCR product. Restriction digestion was subsequently performed using EcoR1 restriction enzyme and the fragments were electrophoresed on an agarose gel. (EcoR1 cuts allele B at a site 115bp from the end of the sequence.) What are the sizes of the subsequent DNA fragments? 1) 115bp + 140bp 2) 205bp + 255bp 3) 140bp 4) 205bp + 255bp + 115bp 5) 140bp + 205bp + 255bp 6) 255bp + 115bp + 140bp 7) 115bp 8) 255bp 9) 115bp + 255bp 10) 255bp + 115bp + 140bp + 205bp 11) 140bp + 205bp 12) 205bp 13) 205bp + 115bp 14) 140bp + 255bparrow_forwardA linear DNA fragment was produced by digestion with the restriction enzyme, Xba1. This fragment with XbaI(X) sites on both ends was then further digested with HindIII (H) and EcoRI (E). Draw a restriction map of the linear fragment based on the gel electrophoresis results shown below. X H Marker E H/E __2000bp __ __1500b __1300bp __ __ __1000bp __ __700bp __ __500bp __400bp __300bp __ __200bp __ __ __100bparrow_forwardThe gel below shows results for the bitter tasting SNP analysis from a CH306 class from a few years ago. Analyze the results and annotate the gel to indicate the bitter tasting ability and homozygous/heterozygous status of each of the individuals represented on the gel. There are three lanes of markers, and the first non-maker lane on the left of the gel is an uncut control PCR product (i.e. there are a total of 10 individuals on the gel starting in lane 3).arrow_forward
 Human Anatomy & Physiology (11th Edition)BiologyISBN:9780134580999Author:Elaine N. Marieb, Katja N. HoehnPublisher:PEARSON
 Biology 2eBiologyISBN:9781947172517Author:Matthew Douglas, Jung Choi, Mary Ann ClarkPublisher:OpenStax
 Anatomy & PhysiologyBiologyISBN:9781259398629Author:McKinley, Michael P., O'loughlin, Valerie Dean, Bidle, Theresa StouterPublisher:Mcgraw Hill Education,
 Molecular Biology of the Cell (Sixth Edition)BiologyISBN:9780815344322Author:Bruce Alberts, Alexander D. Johnson, Julian Lewis, David Morgan, Martin Raff, Keith Roberts, Peter WalterPublisher:W. W. Norton & Company
 Laboratory Manual For Human Anatomy & PhysiologyBiologyISBN:9781260159363Author:Martin, Terry R., Prentice-craver, CynthiaPublisher:McGraw-Hill Publishing Co.
 Inquiry Into Life (16th Edition)BiologyISBN:9781260231700Author:Sylvia S. Mader, Michael WindelspechtPublisher:McGraw Hill Education


